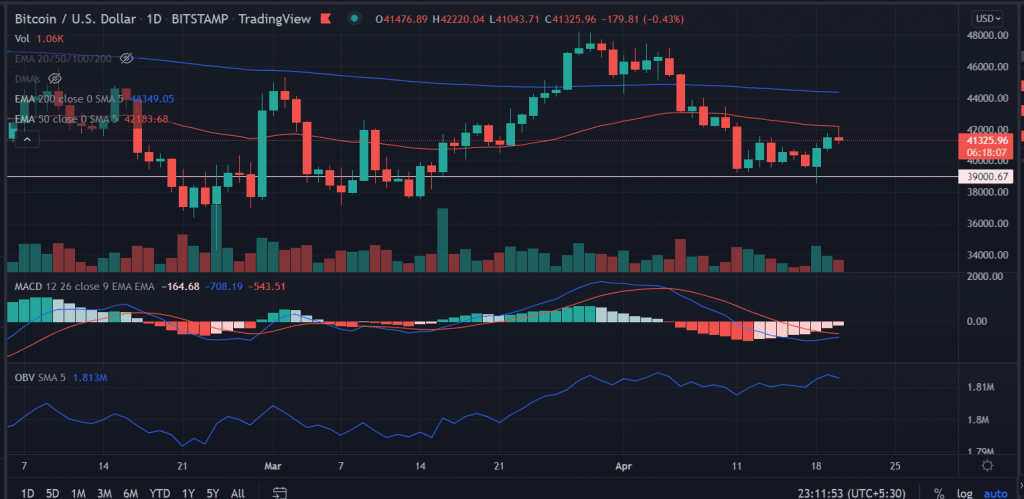
BTC’s price shows signs of consolidating after two days of consecutive gains. The BTC is showing consolidating in the range of $39,000- $42,000 with a positive biasness. On the broader time frame, the technical set-up indicates infringement of the upper side to reach the higher levels in the short term.
- BTC price trades in a very limited price action still hold near $42,000.
- On the daily chart, the price forms higher highs and lows formation since January 23.
- However, the downside risk remains intact as momentum oscillators remain neutral.
BTC price touched the highs of $42,195.40 on Wednesday, however, retraced sharply as the trading extends in the U.S session.
An acceptance above the 50-day EMA (Exponential Moving Average) could be considered a key level triggering an upside breakout in BTC. The first upside target could be found at the April 6 highs at $45,548.77.
This also coincides with the break of another important moving average of 200-day EMA.
On the flip side, a fall below the session’s low would invalidate the bullish hypothesis in the asset. In that case, the price could drop toward the horizontal support zone at $39,000. Further, a break below the lower consolidation range would prompt the sellers to take out the lows of March 7 at $37,169.52.
Trending Stories
As of writing, BTC/USD is trading at $41,369.78, down 0.33% for the day. The pioneer cryptocurrency is holding a 24-hour trading volume of $26,120,671,166 as updated by the CoinMarketCap.
Technical indicators:
OBV: The On-balance volume continues to hold near the overbought zone since March 29. The price has retraced since then but the volumes stand strong indicating the underlying bullish sentiment.
MACD: The moving average convergence divergence remains in the positive zone advocates for an upside outlook.


