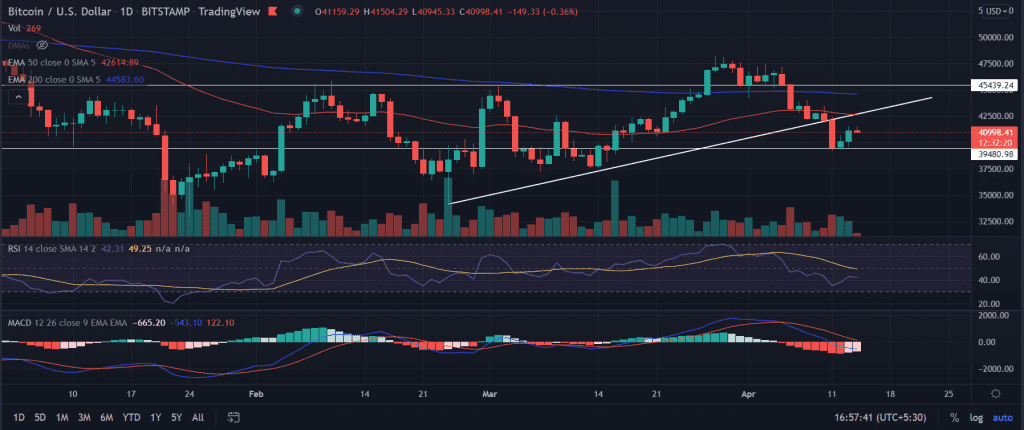
BTC’s price shows a lack of momentum after locking gains for the past two sessions. The price consolidates in the price range with modest movement. BTC’s price touched swing highs near $48,234.00 but failed to sustain the gains beyond the mentioned levels.
- BTC price trades in a relatively tight range with no meaningful price action.
- Investors can expect the price to move toward $45,000 with the support of above-average volumes.
- However, the price remains pressured below the ascending trend line.
BTC price looks for upside gains
On the daily chart, the BTC price hovers above the psychological $40,000 level, where the BTC buyers struggle to sustain the gains. However, the recent technical setup suggests that BTC could jump back to the recent highs, though challenges remain.
A daily close above the session high could fuel the upward movement toward the 50-day EMA (Exponential Moving Average) at $42,680.07. This would coincide with the break of the ascending trend line.
Next, market participants would keep their eyes on the critical 200-day EMA at $44,700 followed by the ultimate target of the horizontal resistance line at $45,000.
While things look mildly positive for the BTC price, a failure to hold the key support area around $39,000 would trigger a fresh round of selling in the pioneer cryptocurrency.
Trending Stories
In this scenario, investors would collect the liquidity from the demand zone extending from $37,500 to $35,000.
Bitcoin price surged nearly 41% from the late February lows of $34,324.05.
As of press time, BTC/USD trades at $40,968.20, down 0.44% for the day. As per the CoinMarketCap, the largest cryptocurrency holds the volume at $28,589,975,310 in the past 24-hour.
Technical indicator:
RSI: The daily relative strength index jumps from the oversold zone but still hovers below the average line.
MACD: The moving average convergence divergence shows a neutral stance on the daily chart.


