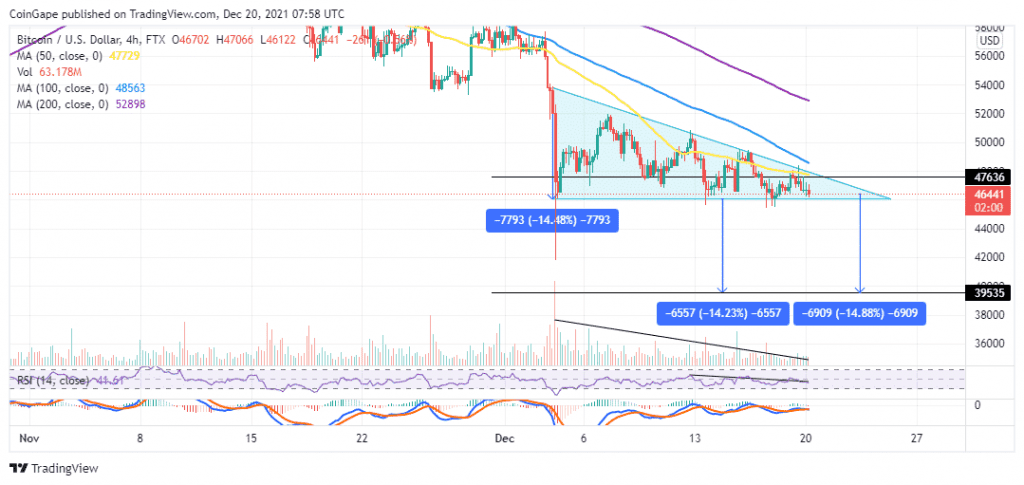
Bitcoin price forms a descending triangle pattern, hinting at 14.88% correction. The decreasing trading volume and the position of the SMAs above the BTC price show that recovery is a huge challenge.
Bitcoin (BTC) price has been suffering under the strong arms of the bears since the all-time high of $69,000 traded on November 10. These losses tested area under $46,500 to the extent of confirming support at $46K. Recovery attempts have been numerous, but Bitcoin price has not made significant progress toward the record high.
BTC price is down approximately 2% in the past 24 hours and 5% on the week. Its trading volume is up 11.39% to $28,283,935,112 in the past 24 hours, according to data from CoinMarketCap. The increasing trading volume in contrast with the decreasing price suggests that there are massive sell orders that are threatening to pull the price of the big crypto lower.
At the time of writing, Bitcoin price teeters at $46,441 and appears to have formed a descending triangle chart pattern on the four-hour chart. Bulls are currently dealing with overhead pressure from $47,636 level where the triangle’s descending trendline and the 50-period SMA coincinde. Holding above the 50 SMA has become very crucial for the resumption of the uptrend. However, the overall technical picture shows that BTC may drop further in the near term.
The chart pattern will be validated if Bitcoin price breaks below the horizontal trendline (X-axis) at $46,080. The breakout should occur before the trend lines converge and has a target equal to the distance between the triangle’s widest points. For instance, BTC will likely dump 15% to test support at $39,500 before recovery occurs.
BTC/USD Four-Hour Chart
The bearish outlook is accentuated by the down-sloping moving averages and the decreasing trading volume. Moreover, the RSI has been moving downwards pointing suggesting that the bears are determines to pull the Bitcoin price lower.
Moreover, the Moving Average Convergence Divergence (MACD) indicator has just sent a call to sell BTC signal on the same four-hour chart. This just happened today when the MACD line (blue) crossed below the orange signal line suggesting Bitcoin’s market sentiment has flipped bearish.
Looking at the other side of the fence
The bearish outlook may be invalidated if support at the $46,080 holds and BTC flips the 50 SMA into support. BTC’s uptrend will resume as the price slices through the triangle’s descending trendline at $47,636 confirming a bullish breakout.


