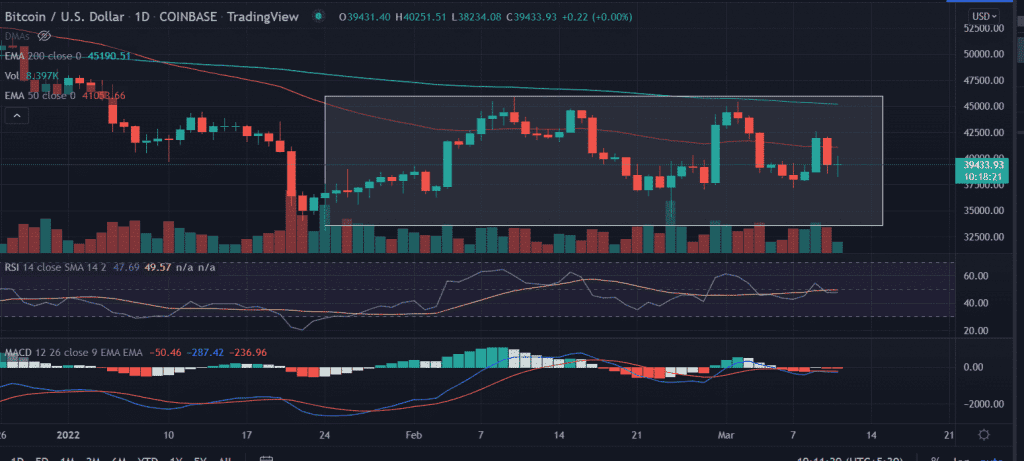
Bitcoin price trades with small gains on Friday as it recovers from the previous session’s declines. The formation of ‘Doji’ candlestick suggests investors are clueless about the next move but hovers near $40k. A decisive close above $40k will set the further directional setup.
- Bitcoin price hovers near $40k with modest gains as the weekends begin.
- Expect a range-bound movement toward $45K inside rectangle formation.
- Remains pressured below 50-day and 200-day EMAs on the daily chart.
The largest and most famous cryptocurrency has a 24-hour trading volume of $30billion. As of publication time, BTC/USD is trading at $39,903.33 up 1.13% for the day.
Bitcoin price trade sideways with a positive bias
On the daily chart, Bitcoin price moves inside the ‘Rectangle’ formation since January 24, where the lower range is capped at $35k, and the upside range is locked near $45k.
In addition to that, the price reveals a rising lower level but the upside is tagged at $45k. Now, the formation of a ‘Doji’ candlestick will result in a bounce-back in Bitcoin price.
However, BTC prices face many upside hurdles that continue with gains. The immediate hurdle is placed at 50-day EMA (Exponential Moving Average) at $41,007.
An acceptance above the moving average will bring the critical 200-EMA that coincides with $45k in play.
On the other hand, if the price slips below the session’s low then bears will target March 7 lows of $37,161.88. Moving further down Bitcoin price could retrace back to the lows of January 24 at $32,933.33.
Technical indicators:
RSI: The daily Relative Strength Index is oscillating near the average line with a neutral bias. Currently, it is reading at 47, an uptick in the indicator could push the price higher.
MACD: The Moving Average Convergence Divergence is hovering below the midline with a mild bearish bias.


