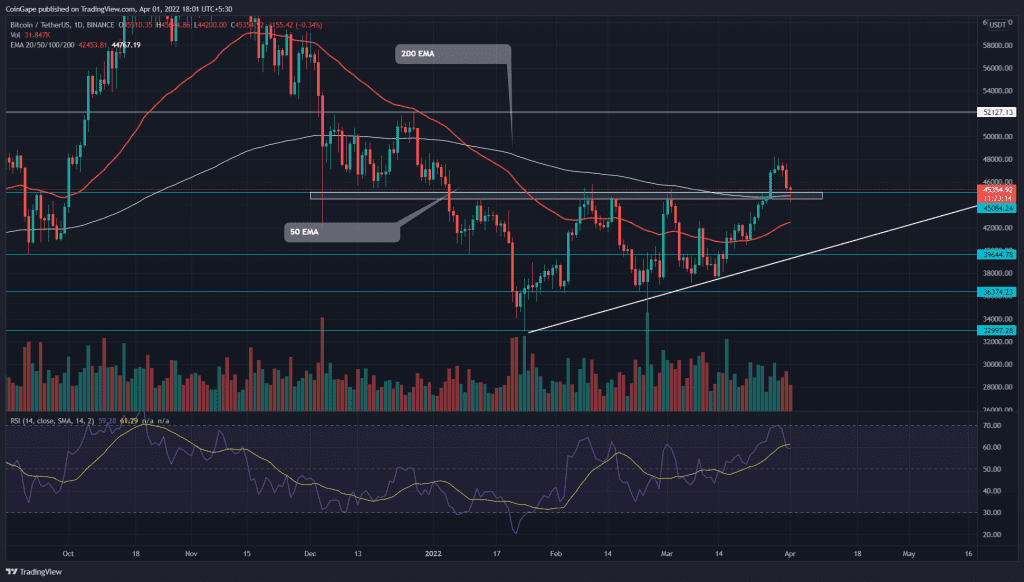
On March 28th, the Bitcoin(BTC) price turned down from the $48086 mark, the highest level it reached in the past three months. Thus, the coin price plummeted to $45000 breached resistance to reinforce the bullish momentum for another leg-up.
Key points:
- BTC chart shows long-tail rejection at $45000 flipped support
- The post retest rally could pump the Bitcoin price by 15.5%
- The intraday trading volume in the AVAX is $2.08 Billion, indicating a 5% gain
Source- Tradingview
For the past few weeks, the BTC/USD pair consolidated in an accumulation phase governed by the ascending triangle pattern. The upcoming trendline supported the new higher lows during the recovery rally and prevented the coin holders from excessive loss.
On March 14th, the recent bull cycle from the support trendline initiated with a long bullish engulfing candle. The sustained buying rose the coin price by 27% as it breached the $45000 neckline resistance.
The pattern completion suggests the accumulation phase is over, and the buyers could lead the way. However, the BTC price reverted from the $48086 high and plunged 7% to retest the $45000 mark.
The hammer candle(long-tail rejection) at 200-day EMA and $45000 level suggests sufficient demand pressure from traders. If buyers could sustain the BTC price above the flipped support, the bullish momentum would escalate and drive the coin by 15.5% to its next target at $52500.
On a contrary note, if sellers pull the Bitcoin price below the $45000 mark, the following fakeout could sink the coin back to ascending trendline
- Resistance level- $48600, $52500
- Support level- $45000, $42000
Technical indicator-
Along with $45000 resistance, the BTC price also sliced through the 200-day EMA. Furthermore, the coin buyers can expect valid support from these breached EMAs(20, 50, 100, and 200) with the ongoing correction.
The minor pullback has slumped the RSI slope below the 14-SMA line. However, the indicator’s value sustaining above the neutral line(50) maintains a strong bullish sentiment.


