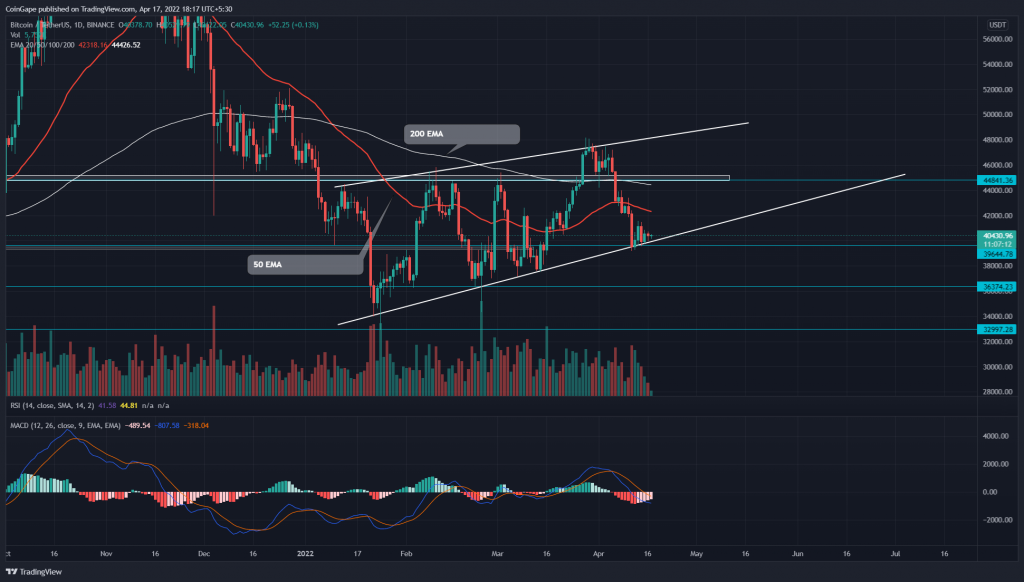
The Bitcoin price witnessed a short-term bull rally resonating in the inverted Flag pattern channel. However, the recent sell-off in the crypto market has sunk the coin price to shared support of ascending trendline and $40000. The decreasing volume activity suggests a bullish reversal to the $45000 mark.
Key points:
- The BTC price would maintain a weekly closing above the $40000
- The inverted Flag pattern governs the BTC price action
- The intraday trading volume in the Bitcoin is $16.6 Billion, indicating a 12.5% lost
Source-Tradingview
Responding to the bearish flag pattern channel, the Bitcoin price plunged below the $45000 support on April 6th. This level acted as a crucial resistance last quarter, and a bear trap mounted on its breakout triggered a significant sell-off last week.
The BTC/USDT price dropped to the $40000 psychological support level during the freefall, registering a 10% fall. However, the ascending trendline aligned with the $40000 support, prevented a further loss, and coiled the price action in a minor consolidation.
The inverted flag is a downtrend continuation pattern that intensifies the selling momentum if the coin price breaches the dynamics support trendline.
Trending Stories
Conversely, If the Bitcoin price sustains above the $40000 mark, the buyers may trigger another bull cycle to reach the overhead resistance. Furthermore, until the support trendline is intact, the market participant can maintain a short-term bullish trendline.
- Resistance level- $45000, $48100
- Support level- $40000, $36400
Technical indicator-
EMAs: The 50, 100, and 200-day EMAs are moving flat, indicating a range-bound rally for BTC. However, the coin price is trading below these EMAs, and with bearish crossover among the 20-and-50-day EMA suggests the sellers hold the advantage.
MACD indicator: The MACD and signal line dropped below the neutral zone due to the recent bear cycle. However, the decreasing red bars on the histogram chart undermine the selling momentum.


