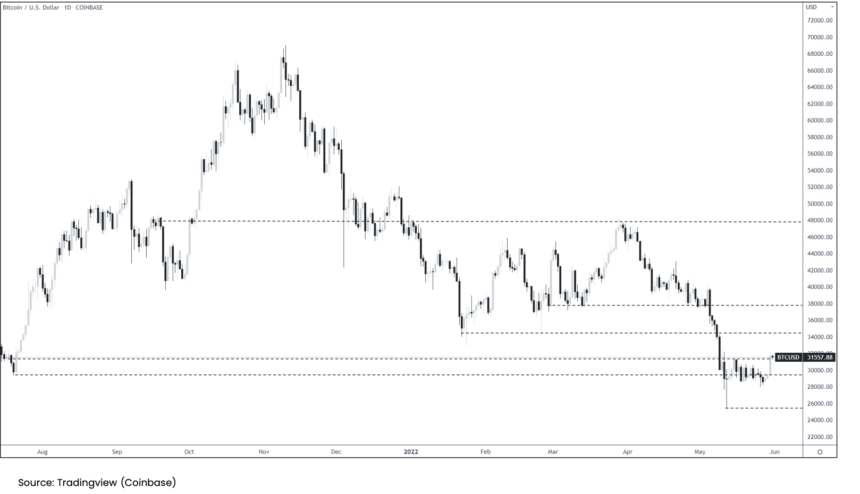
The price of bitcoin has been doing significantly well compare to where it was about a week ago. It has now recovered above a highly coveted point, returning some faith back into the market. However, the position where the digital asset currently resides is one that is unstable. Even though it seems to have found its footing above the $31,000 level, there is still the question of what this recovery actually means in the short term.
Fakeout Or Breakout?
It is important to note that the price of bitcoin had trended for a long time between $29,000 and $30,500. It spent quite some time here as the cryptocurrency had consolidated for the longest time. With its most recent recovery, it had broken out of this consolidation point. But there hasn’t been enough by the way of recovery to simply be sure that this is one that will continue.
Related Reading | Billionaire Tim Draper On What Will Trigger The Next Bitcoin Bull Market
Indicators point to this being a potential critical turning point for the price of bitcoin. Where it goes from here will likely determine the path of the digital asset for the rest of the month. For the cryptocurrency to really establish this as a breakout position, it would need to range upwards and break, its next significant resistance point which lies at $34,500.
Now, given that bitcoin is still languishing at the $31,000 territory, a rally towards $34,500 would need to be accompanied by tremendous momentum from the market. However, if this happens, then the digital asset can establish support at the same point that provided a good cushion at the beginning of the year.
BTC in critical position | Source: Arcane Research
As for a reversal, a potential takeout would have serious implications for the crypto market. Granted, the digital asset has managed to establish great support at $29,000, as evidenced by market movements in the last few weeks. However, a break below $29,000 will likely see bitcoin test the $25,000 support level before it begins another recovery trend.
Bitcoin Turning Bullish In Short-Term
The charts show a highly favorable short-term price of bitcoin but that is only dependent on how well it holds on to its current price. Since its recovery above $31,000, the digital asset is now comfortably trading above its 20-day moving average. This points to a slowdown in the sell-offs in the market and possible recovery towards 50-day moving average levels.
BTC continues recovery trend | Source: BTCUSD on TradingView.com
Losses in bitcoin have also slowed significantly since it hit its ninth red weekly close. This losing streak has been its longest in history and has tired even sellers out. A welcome development for the market.
Related Reading | Bitcoin Exchange Outflows Suggest That Investors Are Starting To Accumulate
If this is the case and sell-offs continue to drop, the reversal could be a potential breakout that could set the market on another bull rally, ending the losing streak.
Bitcoin is trading at $31,557 at the time of this writing. It is headed for its first green close in more than two months.
Featured image from MARCA, charts from Arcane Research and TradingView.com
Follow Best Owie on Twitter for market insights, updates, and the occasional funny tweet…


