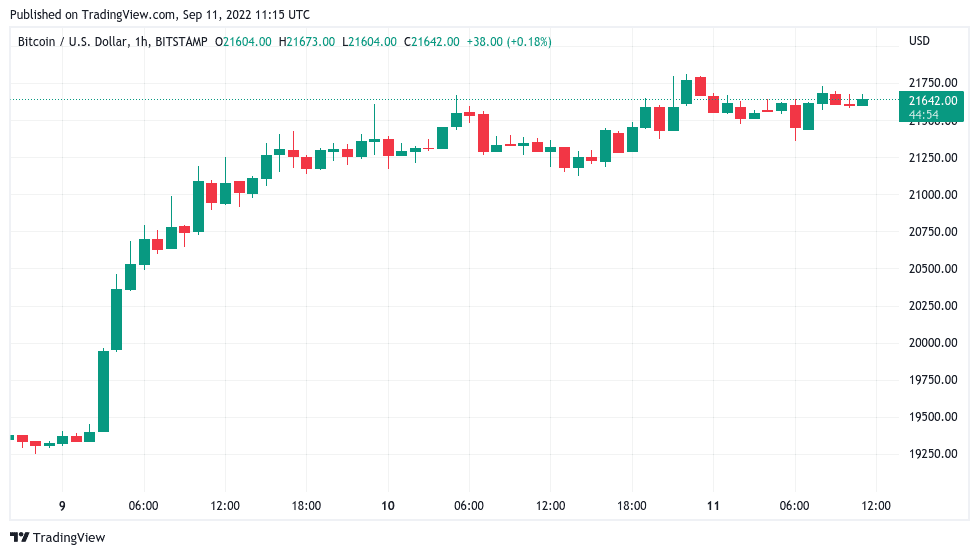
Bitcoin (BTC) stayed higher into the Sep. 10 weekly close as optimistic forecasts favored $23,000 next.
$23,000 targets remain in place
Data from Cointelegraph Markets Pro and TradingView showed BTC/USD hitting $21,730 on Bitstamp overnight — the most since Aug. 26.
The pair managed to conserve its prior gains despite low-volume weekend trading conditions being apt to amplify any weakness.
Among analysts, excitement was palpable going into the new week, one which should prove pivotal for short-term crypto price action.
The Ethereum (ETH) Merge and fresh United States inflation data were the top catalysts expected to influence the market.
“Expect volatility to pick up around next week’s economic data,” on-chain monitoring resource Material Indicators wrote in part of a tweet over the weekend.
“In the meantime, remember…THIS is a rally. If you don’t take profit along the way, you risk giving it all back.”
An accompanying chart showed the Binance BTC/USD order book providing solid resistance near $21,500, a zone which bulls subsequently appeared to overcome.

For popular account Il Capo of Crypto, meanwhile, there was room for additional upside.
Short squeeze is not over. 22500-23000 should be next.
— il Capo Of Crypto (@CryptoCapo_) September 11, 2022
He added, however, that there was a “90% chance” that BTC price action would return back under $20,000 in future.
$23,200 was also a target for trader CJ, who eyed various short-term levels for clues as to long and short entry positions.
– Sweep equal highs at 21.9k and close back below July mid and I’ll be looking for a short targeting the monthly open.
– Reclaim the mid or hold as support and we likely see a fast move into 23.2k pic.twitter.com/xv9oarffsA
— CJ (@IrnCrypt) September 10, 2022
“Septembears” take a beating
The weekly close thus looked set to be a three-week high, Bitcoin already trading above closing prices from the second half of August.
Related: Bitcoin analyst who called 2018 bottom warns ‘bad winter’ may see $10K BTC

On macro, hopes that a sustained risk asset rally would ensue became more vocal, with analyst Hernik Zeberg particularly confident.
“Every time Inflation tops — Stock market rallies! EVERY TIME! And RSI (momentum) — is in turning area,” he argued on the day.
“US CPI coming out on Tuesday. This time will not be different!”

July CPI data showed that the U.S. may have already seen peak inflation.
The views and opinions expressed here are solely those of the author and do not necessarily reflect the views of Cointelegraph.com. Every investment and trading move involves risk, you should conduct your own research when making a decision.


