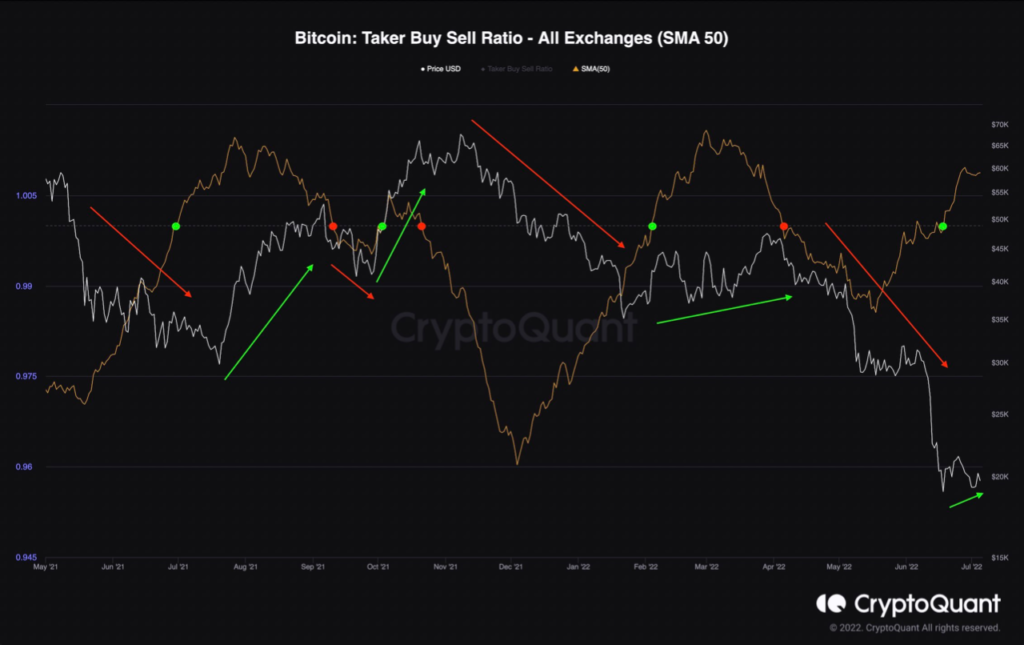
On-chain data shows the Bitcoin taker buy/sell ratio has recently crossed above ‘1,’ a sign that the crypto could experience short-term bullish momentum.
Bitcoin Taker Buy/Sell Ratio Surges Up Above A Value Of 1
As explained by an analyst in a CryptoQuant post, the current BTC taker buy/sell ratio trend may suggest the crypto might see sideways movement or a bullish reversal in the short-term.
The “taker buy/sell ratio” is an indicator that tells us about the ratio between the long and short volumes in the Bitcoin futures market.
When the value of this metric is greater than one, it means the long volume is more dominant at the moment. Such a trend suggests that the general sentiment is bullish right now.
Related Reading | Bitcoin Long-Term Holder Capitulation Approaching Bottom Zone, But Not Quite There Yet
On the other hand, the indicator’s value being less than that implies that the selling pressure is currently stronger than the buying pressure in the Bitcoin market.
Now, here is a chart that shows the trend in the BTC 50-day moving average taker buy/sell ratio over the last year:
Looks like the value of the metric has surged up in recent weeks | Source: CryptoQuant
As you can see in the above graph, the quant has marked the relevant points of trend for the Bitcoin taker buy/sell ratio.
It seems like whenever the indicator has sunk below a value of one, the coin’s price has observed a bearish trend soon after.
Related Reading | Experts Are Calling Out That Bitcoin Is Dead. Projects Like Gnox (GNOX) And Fantom (FTM) Ushering In New Age Of Crypto.
Similarly, the ratio crossing over the one line has usually been followed by a bullish reversal or sideways movement for the crypto.
In recent weeks, the taker buy/sell ratio’s value has once again observed a surge and has now gone past the “one” threshold.
If the past trend is anything to go by, this could mean that Bitcoin may have either a temporary bullish reversal or sideways movement in store for the near future.
BTC Price
At the time of writing, Bitcoin’s price floats around $20.5k, up 2% in the last seven days. Over the past month, the crypto has lost 31% in value.
The below chart shows the trend in the price of the coin over the last five days.

The value of the crypto seems to have shot up over the past day | Source: BTCUSD on TradingView
Over the last few days, Bitcoin has been mostly consolidating sideways. However, in the past twenty-four hours or so, the coin’s value seems to have gained some upwards momentum as it now breaks above the $20k mark again.
Featured image from Kanchanara on Unsplash.com, charts from TradingView.com, CryptoQuant.com


