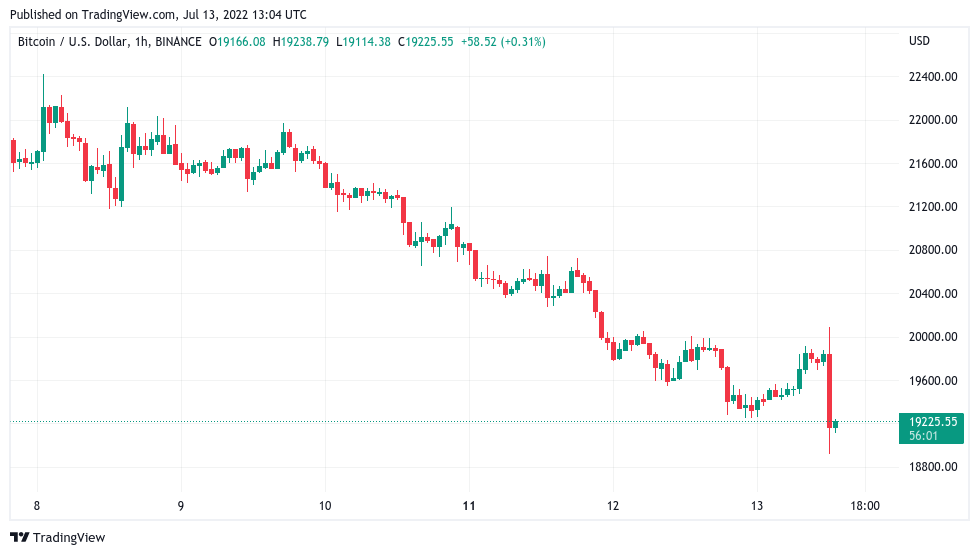
Bitcoin (BTC) fell $800 in minutes on July 13 as the latest United States Consumer Price Index (CPI) data came in far ahead of estimates.
Dollar smashes new 20-year highs on hot CPI
Data from Cointelegraph Markets Pro and TradingView followed BTC/USD as it dived under $19,000 minutes after the June CPI print, which put U.S. inflation at 9.1%.
Expectations had favored 8.8% CPI year-on-year, this still being the highest reading since the start of the 1980s.

With inflation all but guaranteeing further rate hikes from the Federal Reserve, the mood among risk assets — including crypto — swiftly turned sour.
“Peak inflation is here with CPI coming in at 9.1%,” Cointelegraph contributor Michaël van de Poppe reacted, adding that $19,500 should have held for BTC/USD to avoid “cascading south some more.”

The knock-on effect of the CPI numbers was also seen in the U.S. dollar. After the release, the U.S. dollar index (DXY) spiked to new twenty-year highs, forcing the euro below parity as a result.
OUCH! #Euro drops below Dollar parity for the first time in 20yrs. pic.twitter.com/pqwAHMtTjm
— Holger Zschaepitz (@Schuldensuehner) July 13, 2022
“Only 12 out of the last 110 years had inflation above 9%,” Charles Edwards, CEO of crypto asset manager Capriole, continued.
“If inflation was still calculated the same as it was four decades ago, today’s reading would likely dwarf the others.”
At the time of writing, BTC/USD traded back above $19,000, with volatility set to continue into the start of trading on Wall Street.
ETH price back targeting three figures
Altcoins, already falling in line with BTC prior to the CPI event, also gave up recent gains.
Related: Ethereum price risks ‘bear flag’ breakdown, 20% drop against Bitcoin
Conspicuous was Ether (ETH), which threatened to go below $1,000 for the first time since June 30.

Other coins in the top ten cryptocurrencies by market cap were down 3-4% on the day, practically all of the losses coming after the data release.
The views and opinions expressed here are solely those of the author and do not necessarily reflect the views of Cointelegraph.com. Every investment and trading move involves risk, you should conduct your own research when making a decision.


