In this episode of NewsBTC’s daily technical analysis videos, we examine how Bitcoin is trading against other currency pairs and not USD. We also look at BTC against WTI Crude Oil and the S&P 500.
Take a look at the video below:
VIDEO: Bitcoin Price Analysis (BTCUSD): September 28, 2022
The market continues to be shaken up by the strength of the dollar. Following yesterday’s rally in BTC that was immediately wiped out, traders are even more hesitant to pull the trigger with the top cryptocurrency rising again.
Bitcoin Daily Momentum Change Causes Chain Reaction
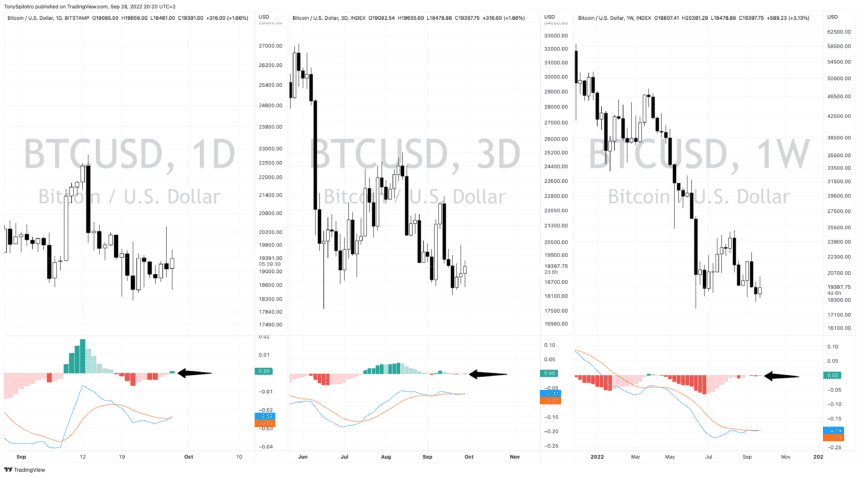
Bitcoin daily has flipped bullish on the LMACD, setting off a chain reaction across a variety of timeframes. In terms of this chain reaction, we have a bullish crossover on the 3-day and the weekly timeframe. Both, especially the weekly, have been like bait, snapping back at bulls each time they attempt to turn the tides of momentum.
Momentum causes a bullish chain reaction of crossovers | Source: BTCUSD on TradingView.com
How BTC Fares Against Other World Currencies
The DXY Dollar Currency Index is the dollar trading against a weighted basket of top national currencies. These currencies include the British pound sterling, the euro, the Canadian dollar, Japanese yen, Swedish krona, and Swiss franc.
Due to the enormous shakeup and volatility in global currency markets, we put Bitcoin up against other currencies and not the standard USD pair.
As you can see, the pound, euro, canadian dollar, and Japanese yen all crossed bullish weeks prior, while the USD pair struggles to do so. Other strong national currencies like the Swedish krona and Swiss franc have yet to cross over much like the dollar.

Comparing The Top Crypto To The S&P 500 And WTI Crude Oil
Continuing the deep dive into unorthodox Bitcoin charts, we’ve combined the charts of BTCUSD and the SPX. This unique chart shows that Bitcoin never made a higher high in late 2021, and the downtrend began with the April peak. This chart also is flipping bullish and has a weekly close confirming the crossover. Bullish momentum will need to grow to sustain a rally.
Next, we’ve compared Bitcoin to what could be the most important macro asset globally: oil. In this comparison, much like the SPX example, we put BTCUSD up against WTI Crude Oil. WTI Crude oil is American produced oil from West Texas Intermediate.
In this oddball trading pair, Bitcoin also had a lower high and a much steeper downtrend. However, Bitcoin flipped bullish against oil several weeks ago, but has yet to produce a meaningful upside move. Is such a move coming soon enough?


