Bitcoin had been on a downtrend for the past few weeks, the coin, however, started to show an uptrend over the past 48 hours. BTC was optimistic as the coin finally broke over its crucial resistance of $40,000. It was seen trading above $41,000 at the time of writing.
Price fluctuations had initially caused some minor deterrents in terms of buying pressure. Over the last two days, however, buying pressure mounted.
BTC was on a bullish sentiment on its four-hour chart. If bulls continue to push prices on the upside, BTC could soon challenge $42,000. The coin could also move towards a price pullback after being on a rise for a few days. The global cryptocurrency market cap stood at $2.03 Trillion after a positive change of 0.5% over the last 24 hours.
Related Reading | TA: Bitcoin Technicals Suggest Bulls Aim Sharp Move Above $42K
Bitcoin Price Analysis: Four-Hour Chart
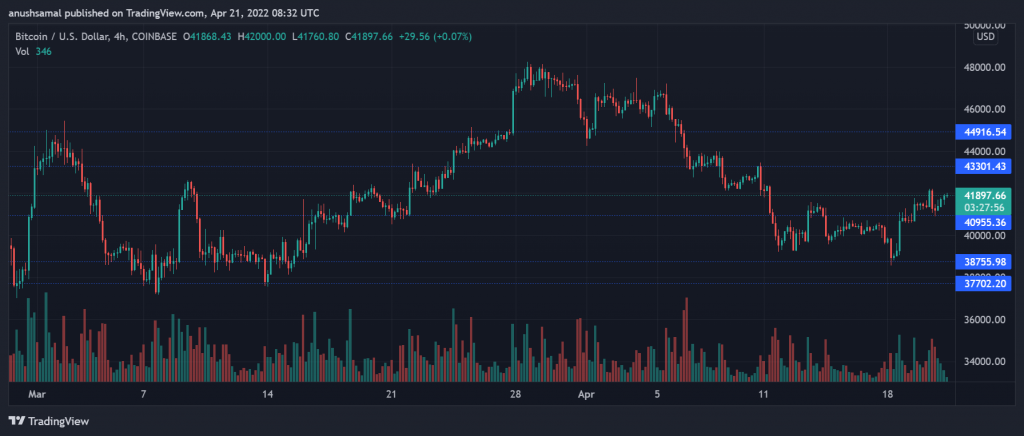
Bitcoin was trading at $41,900 at press time, over the last 2 hours the coin rose by 1.6%. In the last week, Bitcoin had lost its value considerably however it recovered some of its losses as the coin surged in the past 48 hours. Immediate resistance for the coin stood at $42,000, with consistent buying strength the price ceiling would stand at $43,300.
A fall from this level would mean that BTC would be back to $40,000, a price the coin touched thrice in the last week. A fall from the $40,000 mark, the coin would trade near the $38,700, after which the coin would fall to $37,700.
The volume of the Bitcoin traded was less compared to the previous sessions. The last session closed in green which meant that the coin was picking up bullish momentum.
Technical Analysis

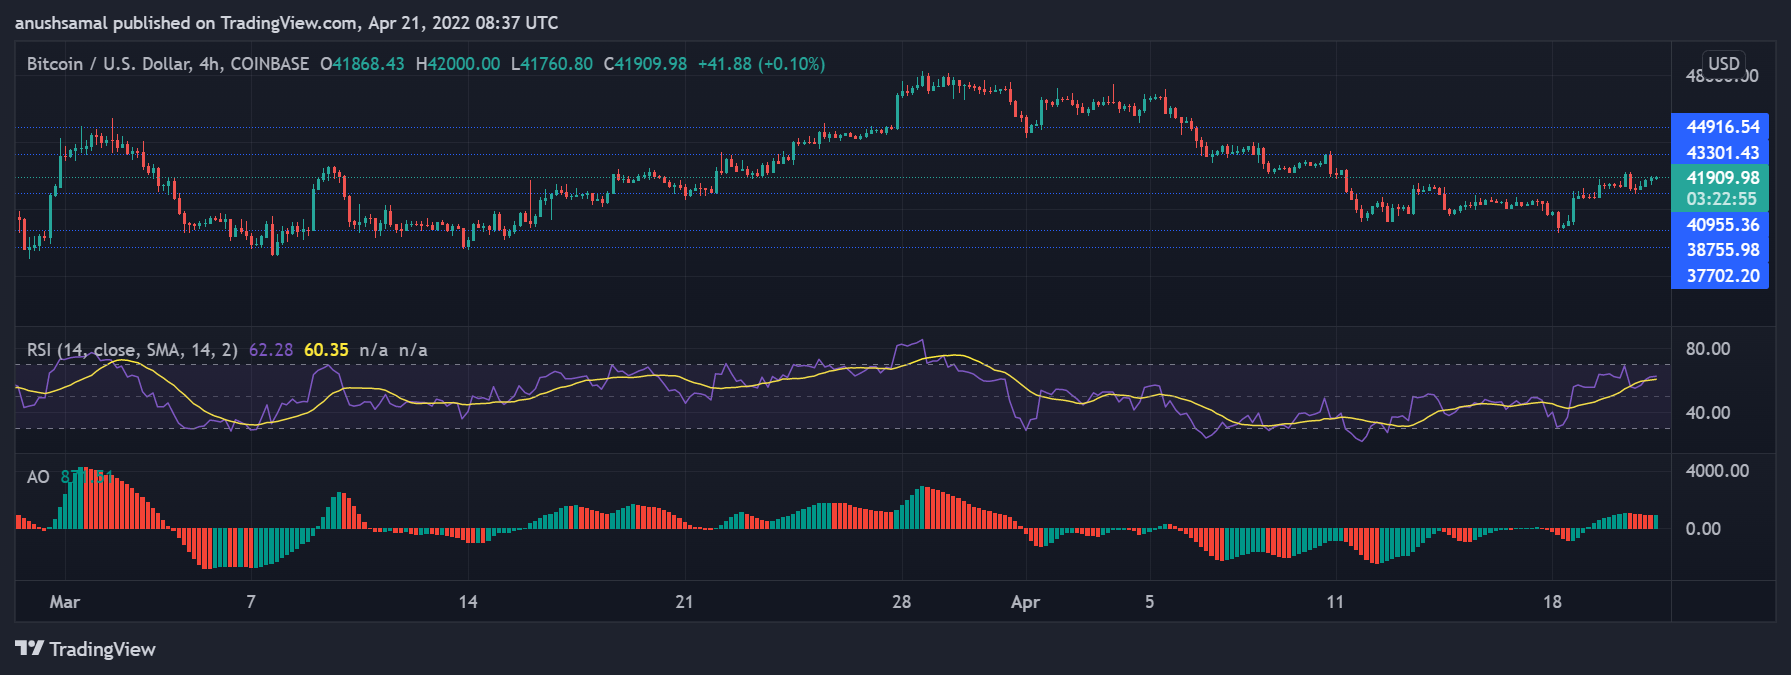
Bitcoin registered buying strength over the last 24 hours shot up. In the last week, buying pressure had dipped considerably as the asset was briefly oversold. With the bulls resurfacing the buyers have come back to the market. A continued bullish pressure could again push BTC to the overbought zone.
King coin also displayed strength as the Awesome Oscillator also displayed a green signal bar. It is quite early to say if the coin would experience a price pullback over the next and immediate trading sessions.

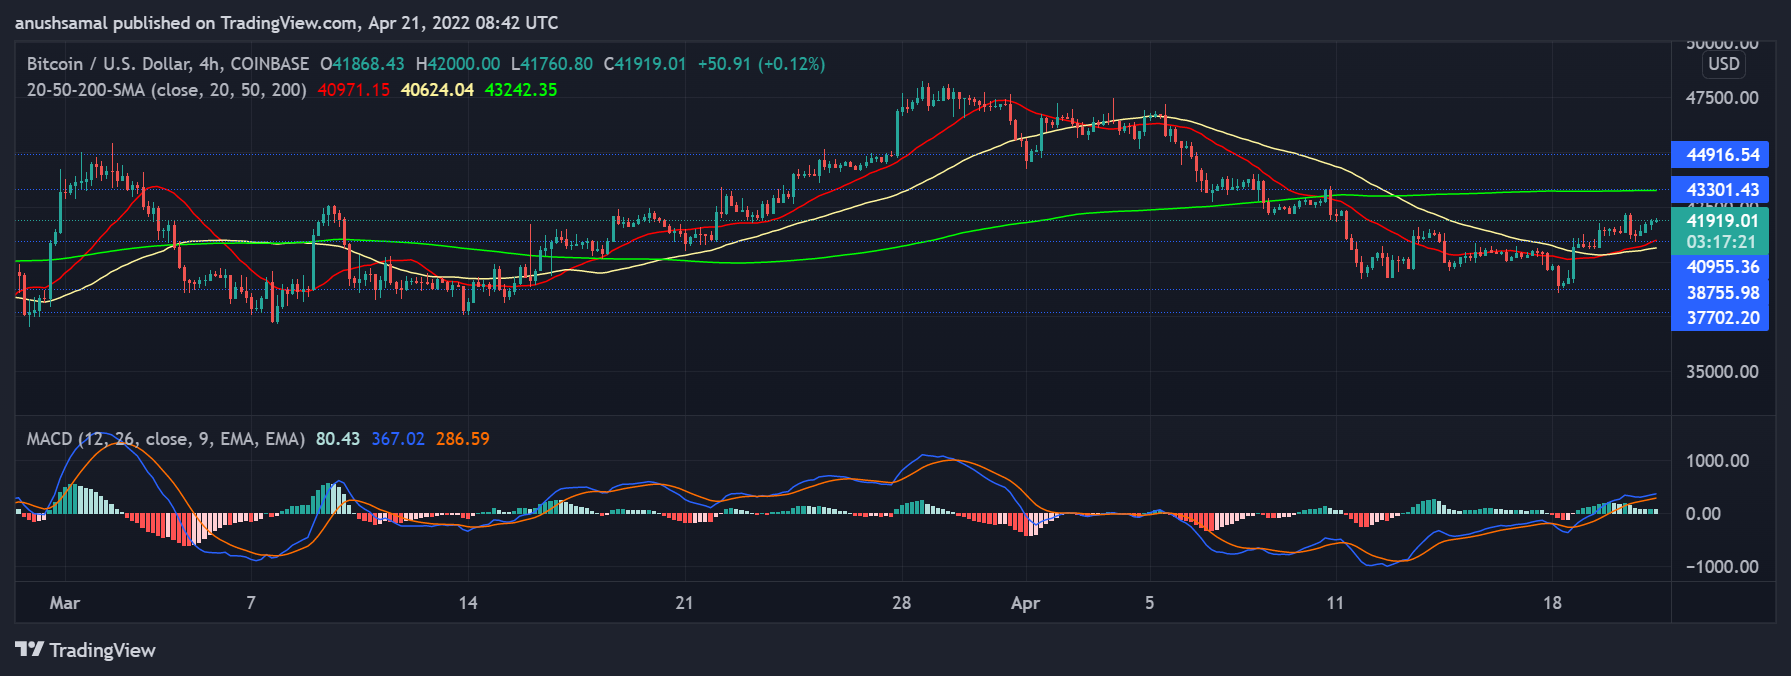
On the four-hour chart, the coin was placed above the 20-SMA line. This meant that the price momentum of the coin was propelled by buyers in the market. Continued buying pressure will push the coin to cross the $43,000 mark.
MACD depicts the market momentum and on the indicator, the coin displayed green histograms which is a sign of positive price action. The coin had also undergone a bullish crossover on the four-hour chart, all of the indicators pointed towards continued bullishness over the immediate sessions at least.
Related Reading | Halfway To The Halving: What This Means For Bitcoin
Featured image from UnSplash, Charts from TradingView.com


