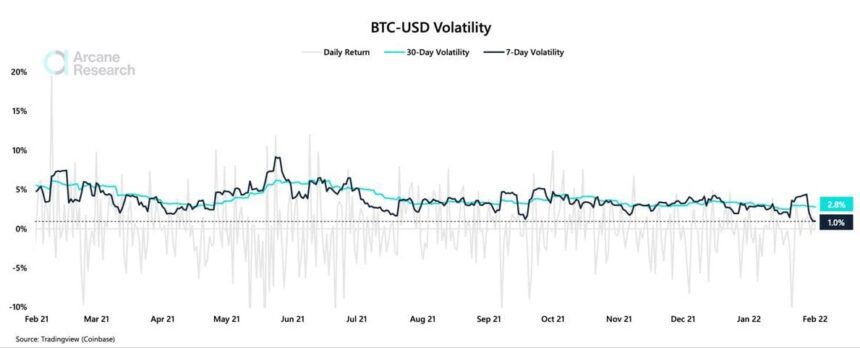
Is this the calm before the storm? Bitcoin volatility is seldom this steady. After a tumultuous downturn that had the whole market upside down, bitcoin’s fiat price is relatively flat. Everyone can breathe and rest, for a while at least. What does this mean and how long will it last, though? That’s what we’re here to explore.
Related Reading | Dwindling Bitcoin Volatility Could Lead To Decisive Move
It’s no secret that the market was expecting a hike in the interest rates, and thus people were selling risky assets. However, the powers that be postponed the increase, and, well, the market calmed down. During this downturn, though, Bitcoin proved once again that the market considers it the least risky asset in the cryptocurrency space. Everyone bled, but Bitcoin considerably less so.
In any case, back to volatility, Arcane Research’s The Weekly Update has the scoop:
“Bitcoin’s 7-day volatility is now at the lowest level since November 2020. Together with the trading volume, the volatility exploded last week when bitcoin dropped below $40,000. After bottoming at $33,500, the bitcoin price has been slowly grinding upwards, and it looks like the market has released sufficient pressure for now. Still, we might see new volatility peaks soon as bitcoin trades closer to several key resistance and support levels that might be catalysts for increased volatility.”
The pressure is off, but, the steadiness might not last. If there’s one thing we can count on in regards to bitcoin is this: volatility will return sooner than later, for better or worst.
BTC/ USD Volatility | Source: Arcane Research’s The Weekly Update
What Are The Resistance And Support Levels?
Bitcoin “has been slowly grinding upwards,” and it’s getting close to that magical number 40. Again, The Weekly Update:
“$40,000 is a key resistance level. With BTC’s slow grind upwards lately, we could see BTC testing this resistance level shortly. A breakthrough would be a relief for the bulls and could signal a trend reversal.”
On the other hand, if things go south and the market starts bleeding again, there’s another number that we have to be aware of:
“Towards the downside, $32,500 acted as support during the initial sell-off, but $29,000 remains as the most critical support level. A breakout below $29,000 would be unsettling, which could cause havoc in the market.”
If Bitcoin touches 40 or 29, the boat might start to rock. Fasten your seatbelts and be sure to wear a life jacket.

BTC price chart for 02/01/2022 on Bitstamp | Source: BTC/USD on TradingView.com
What Causes Bitcoin Volatility?
The short answer is supply and demand. However, since the Bitcoin economy is still small compared to the world’s, several factors can upset or propel the price. From any kind of news to influencers’ opinions to regulation talk or concrete action to whales dumping on the market to interest rates hike rumors. Anything. Also, take this Investopedia insight into account:
“Bitcoin has only been around for a short time—it is still in the price discovery phase. This means that prices will continue to change as investors, users, and governments work through the initial growing pains and concerns until prices stabilize—if a stable point can be reached.”
Related Reading | This Bitcoin Volatility Index Pattern Suggests A Short Squeeze May Be Near
Yes, Bitcoin is the largest cryptocurrency by far and Fidelity thinks it “should be considered first and separate from all other digital assets that have come after it.” However, the asset is still a wild teenager. Expect volatility and learn how to deal with it. It’s going to be a bumpy ride.
Featured Image by Pexels on Pixabay | Charts by TradingView


