Bitcoin’s [BTC] next bull run could depend on how well USDC would flow into exchanges, according to the CryptoQuant CEO Ki Young Ju.
The investor noted that the stablecoin played a crucial role in BTC’s future because a chunk of institutional investors held more USDC than any other stablecoin.
Young Ju noted that organizations, including Goldman Sachs, BlackRock, and Fidelity held USDC. However, about 94% of these holdings were held in wallets off exchanges.
The next #Bitcoin parabolic bull run might begin when massive $USDC flows into exchanges.
For now, 94% of the USDC supply is outside exchanges, some of which are owned by TradFis like BlackRock, Fidelity, Goldman Sachs, etc.
They’ll move when they get orders from their clients. pic.twitter.com/Bqenvgugw1
— Ki Young Ju (@ki_young_ju) October 7, 2022
About moving the needle
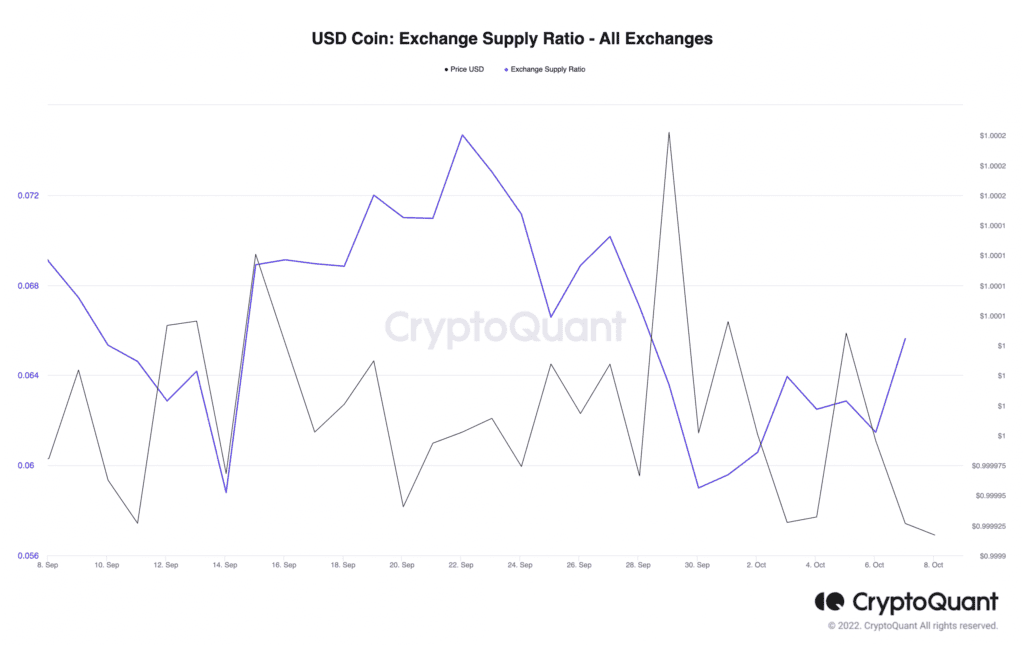
In related developments, it may seem that investors may have paid attention to Young Ju’s call. This was deduced from the data per the USDC exchange supply ratio. According to CryptoQaunt, the supply ratio of the stablecoin has been increasing since 30 September.
Despite retracing on 3 October, it was back up on the charts. At press time, the USDC exchange supply ratio was 0.0656. This implied that some big-wig investors had reserved more of the stablecoin on exchanges in the last few days.
Here’s AMBCrypto’s Price Prediction for BTC for 2022-23
The recent uptick in this regard, however, may not be surprising. According to the whale tracking platform Whale Alert, this was because over $200 million worth of USDC had flown into exchanges in the last 24 hours.
Furthermore, the platform also noted that exchanges, including Binance, FTX, Coinbase, and Huobi, were beneficiaries of these transactions.
🚨 49,752,998 #USDC (49,720,161 USD) transferred from unknown wallet to #FTXhttps://t.co/p4c9BKc9wZ
— Whale Alert (@whale_alert) October 8, 2022
🚨 70,531,070 #USDC (70,524,016 USD) transferred from #USDC Treasury to #Coinbasehttps://t.co/Ov61SLuvsg
— Whale Alert (@whale_alert) October 7, 2022
Interestingly, these whale transactions have impacted the overall exchange inflow volume, which had decreased since 4 October.
According to Glassnode data, the BTC exchange inflow volume was 31,942 at press time. Per the daily exchange flow, the on-chain analytic platform reported that $631.5 million was pumped into BTC while $1.2 billion went out. This brought the netflow to a negative $588.8 million.
A trip to $17,000?
On the flip side, there might be a new twist to the current BTC status. Ghoddusifar, a CryptQuant analyst, was of the opinion that BTC could go further down the charts and hit Delta price. Based on his analysis, BTC was forming a descending triangle pattern and as such could lead to more bearish sentiment.
Additionally, the correlation between the king coin and the stock market wasn’t something to be ignored. With the stock market in red, Ghodduasifar believed a decline to $17,000 was not off the cards. He said,
“Stock indices have decreased and are again above the support level. In case of a breakdown of this level of support from the stock market, we will definitely see a breakdown of the level of support for Bitcoin.”
However, indications from the BTC four-hour chart showed that BTC might not be ready for a further decline. The Exponential Moving Average (EMA) indicated more recovery than a bearish movement.
With the 20 EMA (blue) currently above the 50 EMA (yellow), Bitcoin had the potential to exit the 2.34% 24-hour price decrease. Still, the possibility of a reduction could not be exempted, considering that the 20 EMA looked to be in the downward direction.


