BeInCrypto takes a look at the seven altcoins that increased the most over the past seven days, from Nov 5 to Nov 12. Four of them reached new all-time highs during the week.
These altcoins are:
- Loopring (LRC) : 175.25%
- Kadena (KDA) : 117.15%
- Cartesi (CTSI) : 50.05%
- Helium (HNT) : 48.27%
- Verge (XVG) : 37.57%
- Mina (MINA) : 32.64%
- Litecoin (LTC) : 29.18%
LRC
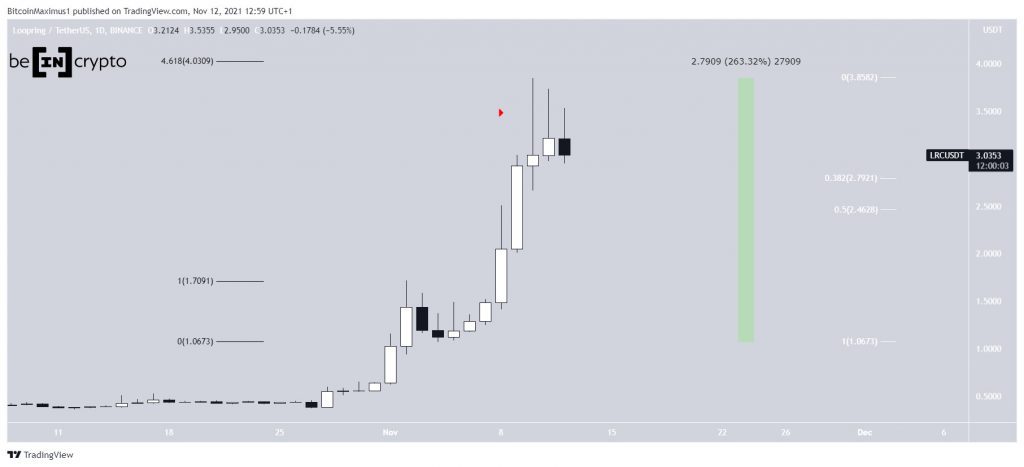
LRC has been increasing at an accelerated pace since Nov 4. In a span of only six days, it increased by 263%. This led to a new all-time high price of $3.85 on Nov 10.
The high was made very close to the 4.618 external Fib retracement level when measuring the previous drop. This level often acts as the top during parabolic upward movements.
In addition to this, the token has created long upper wicks (red icon) for three successive days. This is considered a bearish sign, since the price was pushed down due to selling pressure.
Therefore, it is possible that LRC has reached a local top.
If so, the closest support levels are at $2.79 and $2.46.

KDA
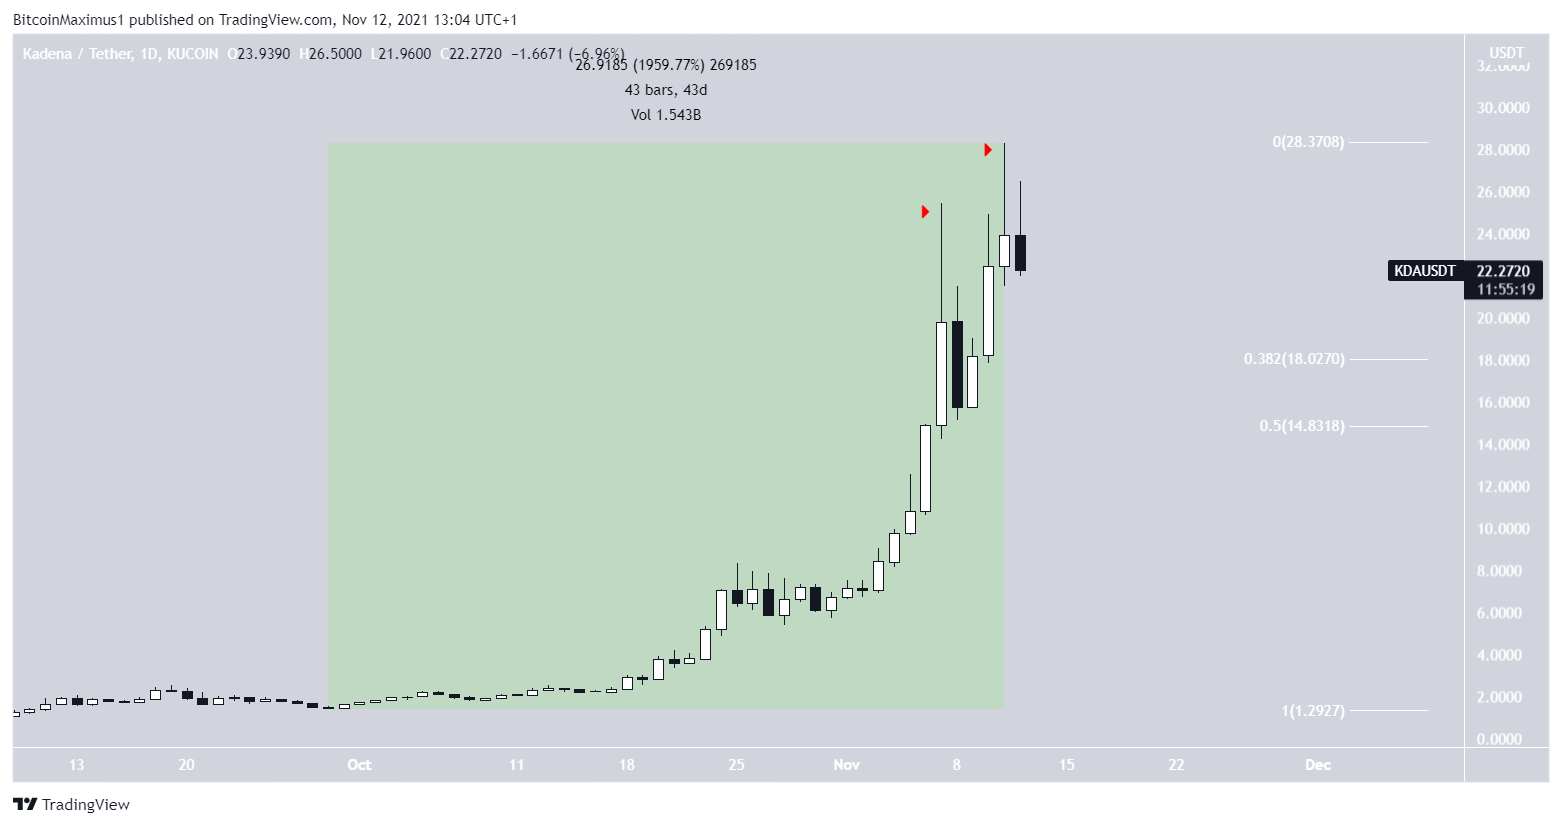
KDA has been increasing at an accelerated rate since Sept 29. In a span of 43 days, it moved upward move 1,952%. This led to a new all-time high price of $28.30 on Nov 10.
Similarly to LRC, it has created two long upper wicks (red icons), which are considered signs of selling pressure, and has been moving downwards since.
If KDA continues to decrease, the closest support levels would be at $18.02 and $14.83.

CTSI
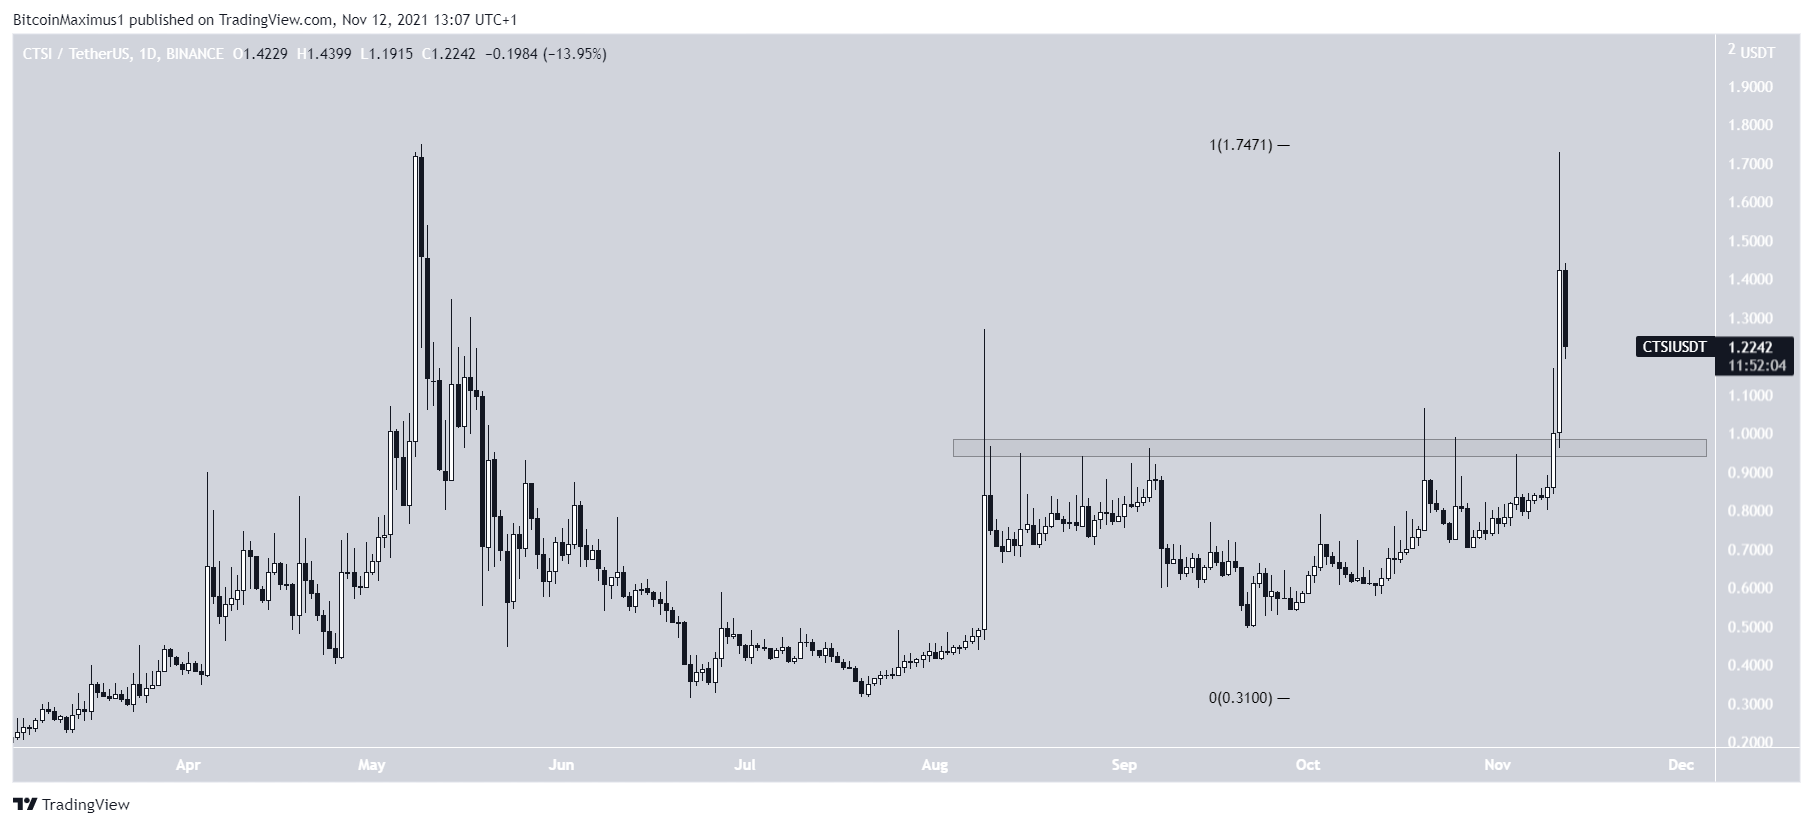
CTSI has been moving upwards since Sept 22. The upward movement led to a breakout from the $0.96 area on Nov 10. The next day, CTSI reached a high of $1.73. The token barely failed to reach a new all-time high, missing the target by $0.02.
CTSI has been decreasing since. If it continues to do so, the $0.96 area is expected to act as support.
HNT
HNT has been increasing since breaking out from an ascending parallel channel (green icon) on Nov 3. The increase culminated with a new all-time high price of $59.27 on Nov 7. However, the token created a long upper wick the same day and has been moving downwards since.
Furthermore, it created a lower high on Nov 11 before resuming its downward movement. This is a bearish sign since it means that the price failed to reach its previous highs.
The closest support areas are at $37.5 and $32.5.

XVG
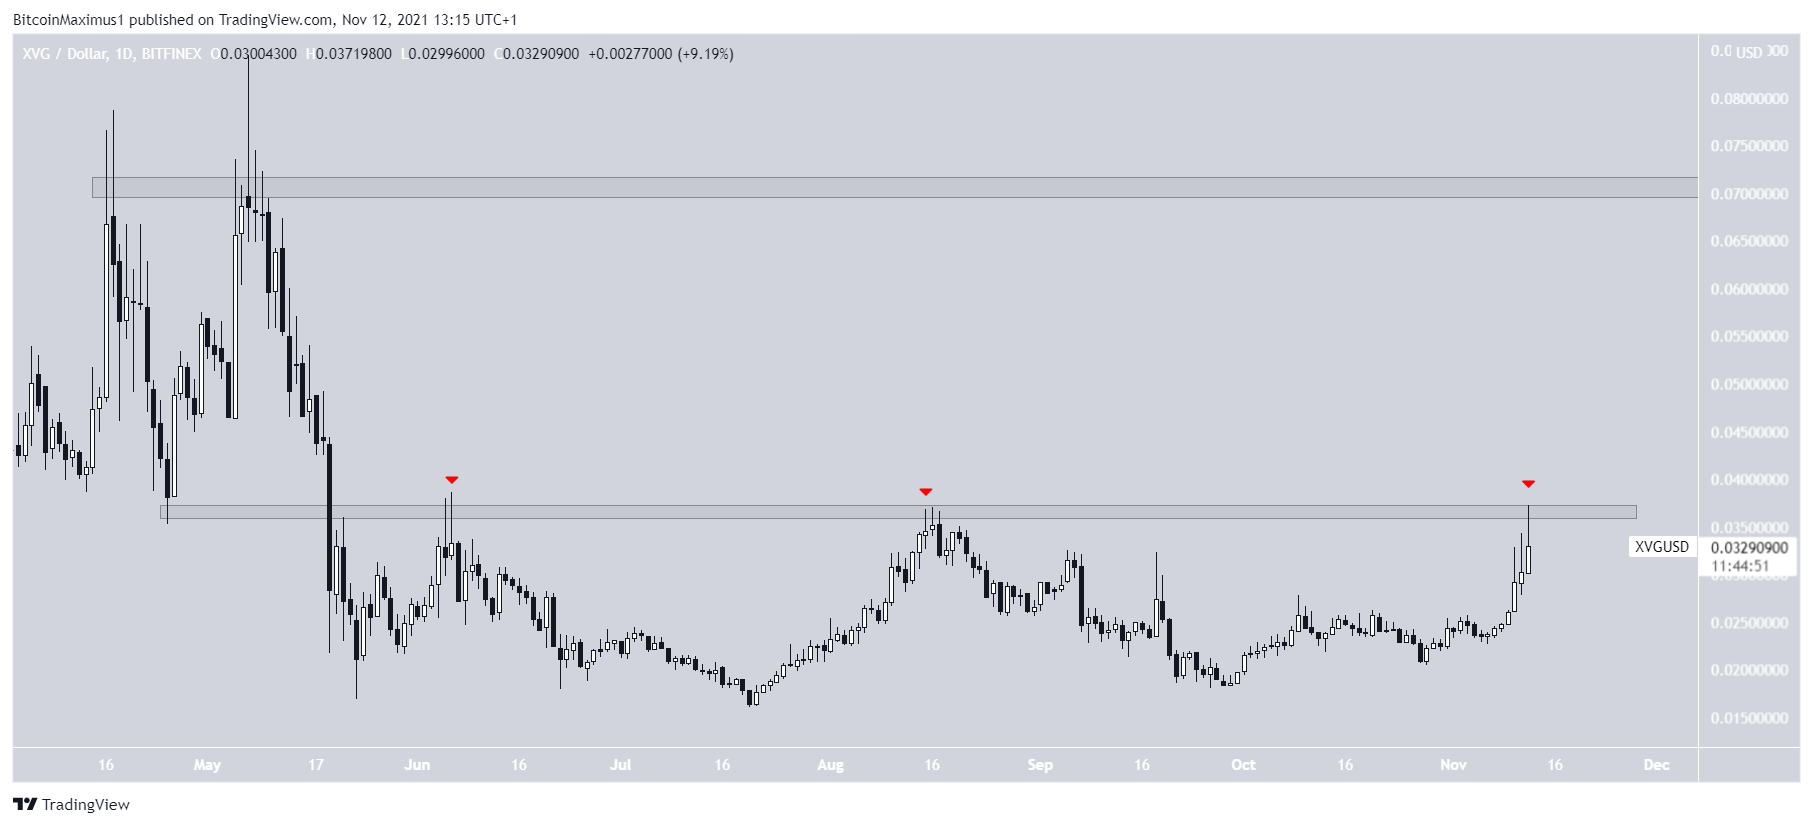
XVG has been increasing since Sept 28. On Nov 12, it reached a high of $0.037 but was rejected by a horizontal resistance area, which has been in place since May. This was the third unsuccessful breakout attempt (red icons).
Since resistances become weaker each time they are touched, it would be likely for the token to break out.
If XVG is successful in breaking out, there would be no more horizontal resistance levels until the $0.07 highs.
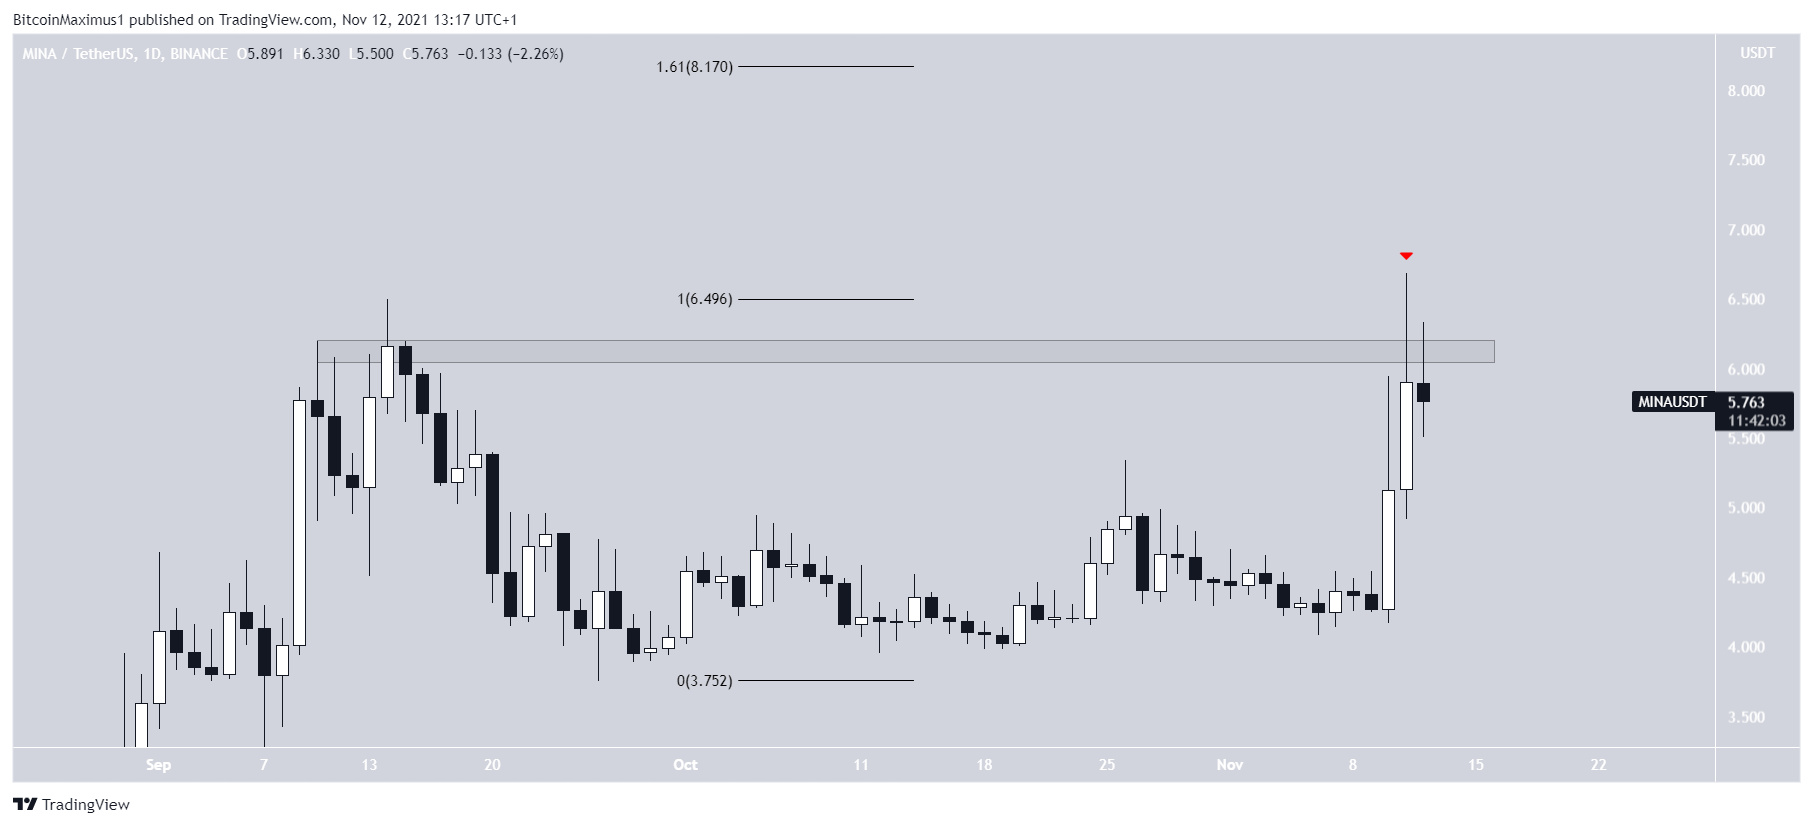
MINA
On Nov 12, MINA reached a new all-time high price of $6.68. However, the same day, it created a long upper wick and decreased. This effectively created a double top, which is considered a bearish reversal pattern.
Furthermore, the token has fallen below the $6.15 resistance area. Until it moves above it, the trend cannot be considered bullish.
If it is successful in breaking out, the next resistance would be at $8.17. This is the 1.61 external Fib retracement resistance level when measuring the previous drop.
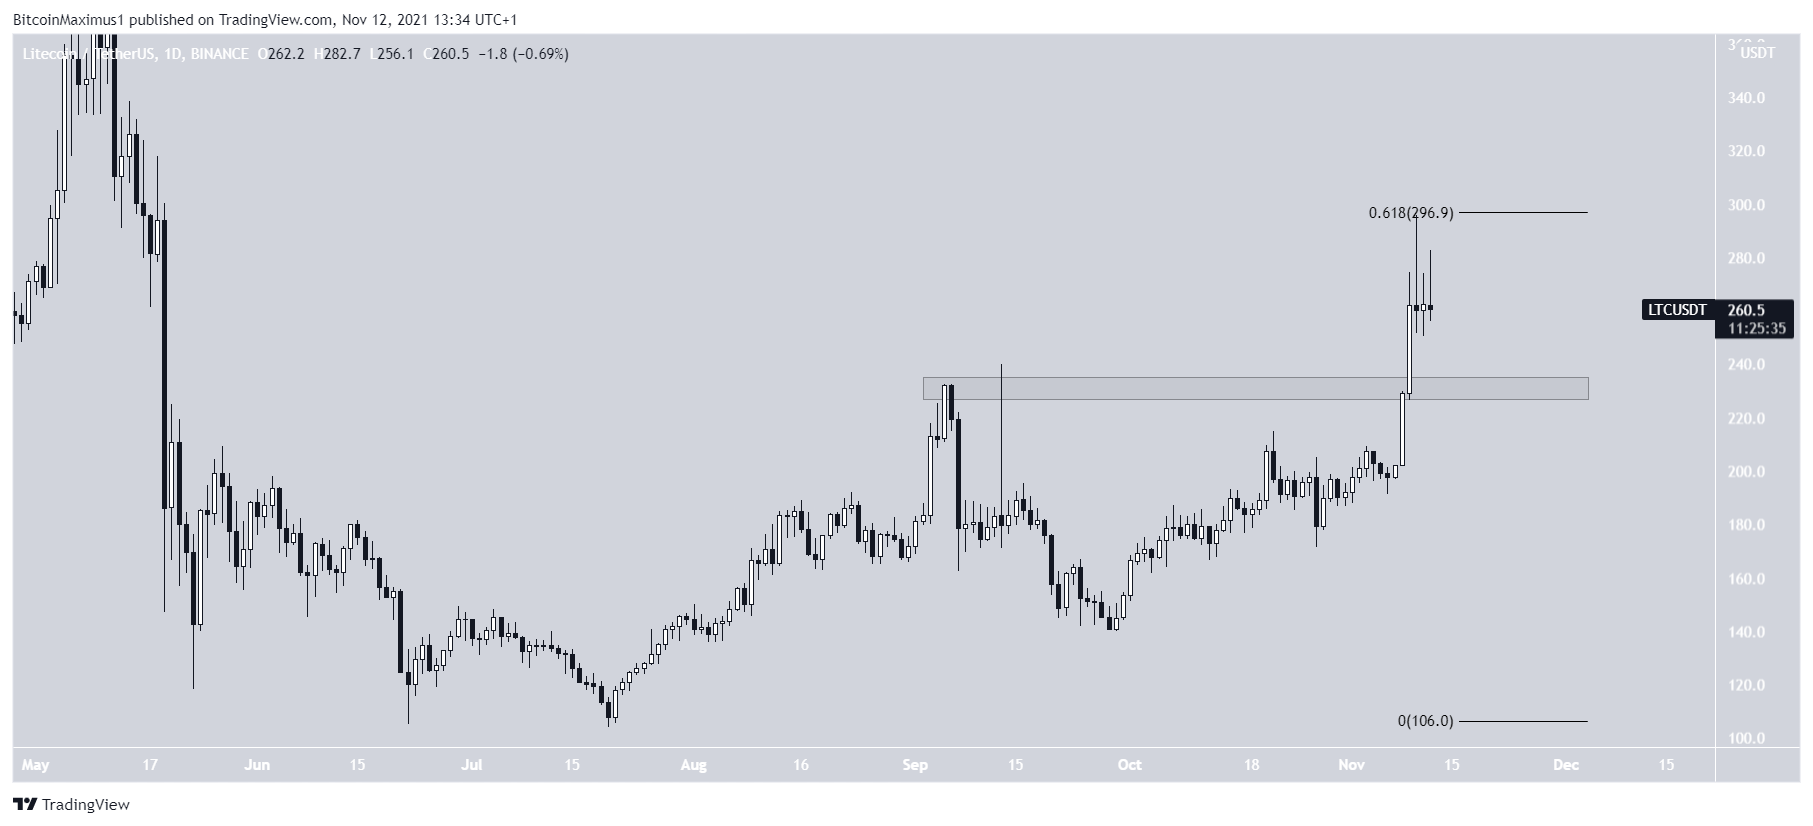
LTC
LTC has been moving upwards at an accelerated rate since Nov 7. The next day, it broke out above the $230 horizontal resistance area, and reached a new high of $295.7 on Nov 10.
The high was made right at the 0.618 Fib retracement resistance level. If LTC manages to break out, it could increase at an accelerated rate due to the lack of overhead resistance.
Conversely, the $230 area is expected to act as support if a short-term drop transpires.
For BeInCrypto’s latest Bitcoin (BTC) analysis, click here.
Disclaimer
All the information contained on our website is published in good faith and for general information purposes only. Any action the reader takes upon the information found on our website is strictly at their own risk.