Kishu Inu price forms a descending triangle pattern, hinting at 61% correction. The decreasing trading volume and the position of the SMA above the KISHU price show that recovery is a huge challenge.
Kishu Inu price has been suffering under the strong arms of the bears since the all-time high of $0.000000010 traded on October 28. These losses tested area under $0.0000000040 to the extent of confirming support at $0.000000003582. Recovery attempts have been numerous, but KISHU has not made significant progress toward the record high.
Kishu Inu was created in April 2021 with the aim of being a decentralized meme project with true utility. KISHU’s mission is to bring popular cryptocurrency concepts to the mainstream. Unlike older, comparable projects, KISHU introduces holders to next-gen concepts such as participation rewards, NFTs, decentralized exchanges, and more.
It has rallied recently in tandem with other meme coins even as the big brothers DOGE and SHIB had a showdown of the meme coins over the last week to see which one will be ranked higher in terms of market capitalization with Shiba Inu surpassing Dogecoin in market cap at one point.
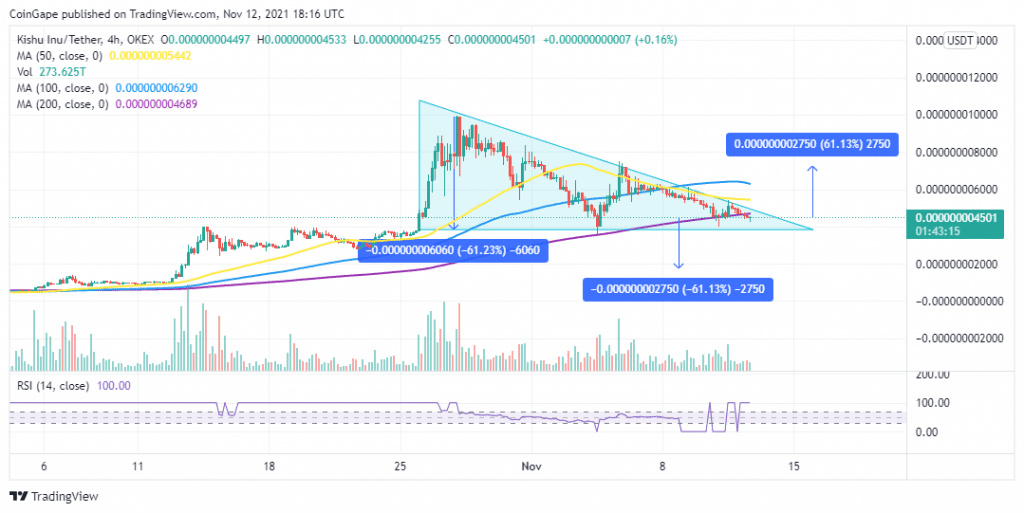
At the time of writing, Kishu Inu teeters at $0.000000004501 and appears to have formed a descending triangle chart pattern on the 12-hour chart. Bulls are currently dealing with overhead pressure from the triangle’s descending trendline. Holding above $0.0000000040 has become very crucial for the resumption of the uptrend. However, the overall technical picture shows that KISHU may drop further in the near term.
The chart pattern will be validated if Kishu Inu price breaks below the hypotenuse. The breakout should occur before the trend lines converge and has a target equal to the distance between the triangle’s widest points. For instance, KISHU will likely dump 61% to test support at $0.000000001750 before recovery occurs.
KISHU/USD Daily Chart

The bearish outlook is accentuated by the down-sloping moving averages and the decreasing trading volume. Moreover, the RSI is massively overbought pointing to a significant Kishu Inu price correction in the near-term.
Looking at the other side of the fence
The bearish outlook will be invalidated if support at the $0.0000000040 and KISHU flips the 200 Simple Moving Average (SMA) into support. Besides, the SuperTrend indicator still shows that Kishu has a bullish outlook, as seen on the 12-hour chart. KISHU’s uptrend will resume as the price slices through the triangle’s descending trendline at $0.000000004957 confirming a bullish breakout.