The broader crypto market did not perform well in the last 24 hours. Accordingly, altcoins like Litecoin, Tron, and MATIC declined over the past day after hitting their respective milestones.
Furthermore, near-term indicators for all these cryptos pointed at decreasing bullish influence.
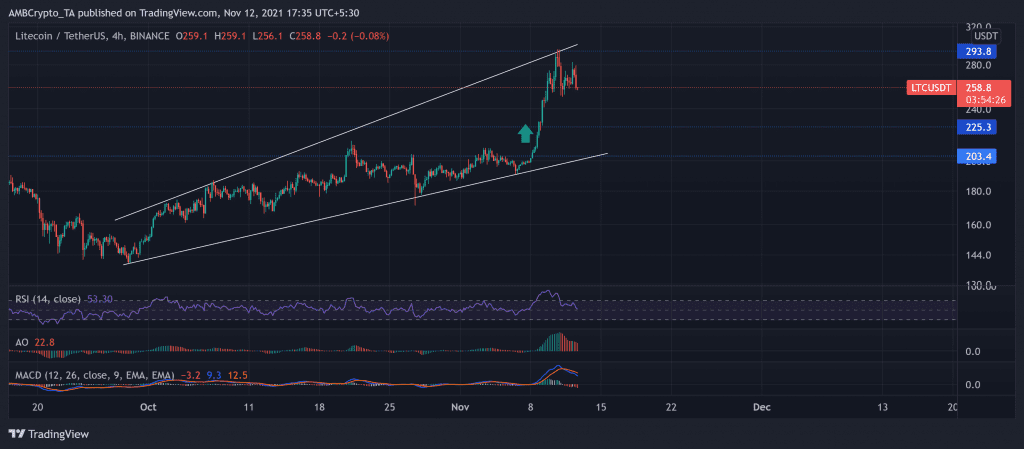
Litecoin (LTC)
LTC steadily rose by oscillating between ascending lines over the past seven weeks. This rally fetched an 82.2% ROI over the past 44 days for the digital currency. The buyers visibly gained accelerated momentum over the past week as they breached the $225-mark (support level).
Moreover, while Bitcoin surged to its ATH on 10 November, LTC encountered its 25-week high on the same day at $295.7. At press time, LTC traded at $258.8 after seeing a nearly 28% weekly ROI.
However, the near-term technicals indicated a possible retracement while the altcoin saw a 9.5% decline over two days. The RSI saw a downfall of 26 points in just two days, undeniably stating significant ease in the bullish power. Further, the AO and MACD confirmed RSI’s conclusion.
Tron (TRX)

Source: TradingView, TRX/USDT
TRX visibly grew after swaying between the parallel channels heading north. The blockchain-based operating system undertook the ascent over the past six weeks while registering a 27% 44-day ROI. Consequently, the rally triggered the price to its 54-day high on 10 November.
However, the bears did not dwindle and showed resistance at the upper channel. Consequently, the price stepped back into the trend after noting a 3.51% 24-hour decline and traded at $0.10692. Although the bears countered the bullish influence, buyers found strong support at the $1.0335-mark.
The near-term technicals complemented the aforestated analysis by depicting a decreasing bullish power. While the RSI dipped below the midline, the MACD and AO flashed red signs. Nevertheless, the ADX was southbound after presenting a weak directional trend.
MATIC

Source: TradingView, MATIC/USDT
Since 12 October, MATIC noted distinctively higher lows while projecting a bullish outlook. The digital token saw an approximately 38% monthly ROI. As a result, the price rallied to its 5-month high on 29 October. After which, the bears ensured to show sustained resistance at $2.093 and pushed the price downhill.
Over the past nine days, the token saw a 21% decline as the price traversed between parallel channels heading south. Bulls seemingly lost power as the sellers tarnished the immediate resistance level at $1.882. At press time, MATIC traded at $1.679 after noting a 3.51% 24-hour decline.
If the bearish streak continues with this intensity, bears aim to find support at the $1.6-mark. Moreover, even the near-term technicals did not favor the bulls.
The RSI was in a downtrend and headed toward the oversold region. Also, the MACD and DMI readings visibly favored the selling pressure. A possible bullish revival after the RSI hits the oversold mark could occur.