Bitcoin has lined up a bearish divergence on its daily chart which suggests a pause to its late-September uptrend. Over the short-mid term, BTC would look at cutting losses, at its immediate defenses while lining up the next up cycle. At the time of writing, BTC traded at $63,916, down by 2.3% over the last 24 hours.
Bitcoin Daily Chart
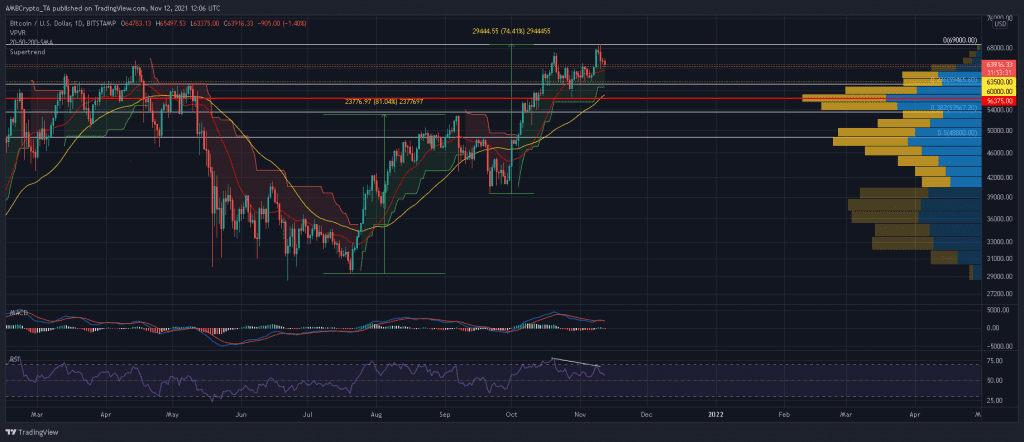
RSI’s bearish divergence combined with the MACD’s bearish crossover suggested that Bitcoin could continue its southbound movement heading into a fresh week. Should BTC weaken the confluence of its near-term support at $63,000 and the 20-SMA (red), another 9% drawdown could be on the cards.
The 50-SMA (yellow), which has often functioned as support during earlier BTC uptrend, would be called into action. The mid-term moving average also clashed with a robust defense between $57,000-$58,600. Once a bullish rebound is established, BTC would look to continue its bull run which kickstarted in late-July and accomplish its year-end targets.
Reasoning
While correctional phases do spook investors, they are healthy over the longer run. For instance, Bitcoin whittled nearly 20% of its value throughout the month of September after its late-July rally and embarked on a fresh up cycle during October-November.
Should BTC pave way for another retracement, December could be an absolute blowout. Reasons for the anticipated drawdown stemmed from a bearish divergence along the RSI and a bearish crossover on the MACD. On the flip side, bulls would need to be cautious of a close below the 50-SMA and Visible Range’s POC- the point where maximum BTC trades were placed in a given timeframe. In such a case, the SuperTrend Indicator would switch to a sell signal and expose BTC to short-selling.
Conclusion
If BTC does weaken below $63,000, it could look to the region between $57,000-$58,600 to stem the bleeding. This zone clashing the 50-SMA (yellow) and Visible Range’s POC, would make it a sturdy defense.