Disclaimer: The findings of the following analysis are the sole opinions of the writer and should not be taken as investment advice
Tron’s gains have been measured over the past month, with its ROI sitting at a respectable 13.5%. While those numbers pale in comparison with smart contract operator Solana’s surge of over 61%, Tron has bested the likes of Cardano and Polkadot.
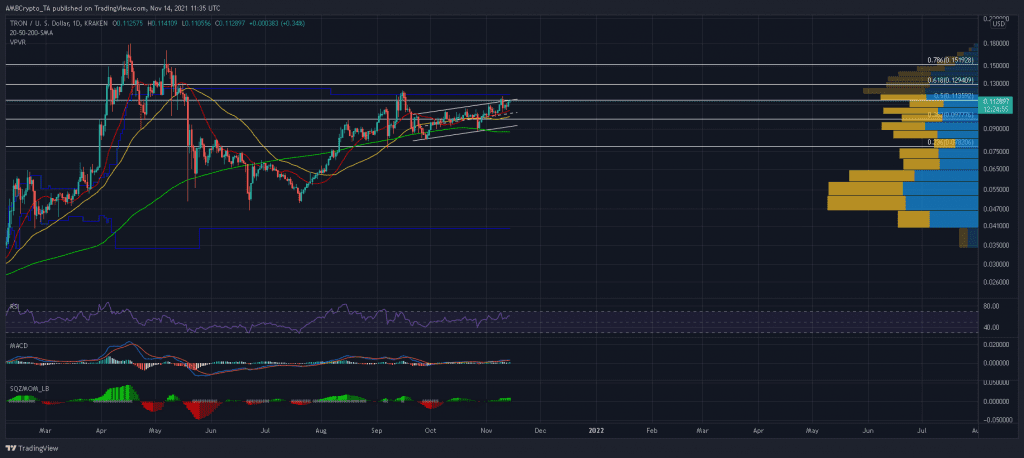
However, the ‘Ethereum Killer’ did face some mid-long term woes. A potential double top at $0.1229 and a move above the value high zone could invite a dangerous sell-off. At the time of writing, TRX was trading at $0.1129, up by 1.3% over the last 24 hours.
Tron Daily Chart
Tron’s up-channel has been active since late September, with six highs formed at the upper trendline and two lows at the bottom trendline. The 20-SMA (red) and 50-SMA (yellow) traded in bullish positions and have often functioned as support during the uptrend. However, TRX was dangerously close to the value high zone (upper blue line). The last time TRX attempted to close above this area, a 33% sell-off was observed as bears rejected the uptrend.
Moreover, a double top at $0.1229 was another obstacle bulls had to deal with in order to inflict an upwards breakout. As per the Visible Range Profile, TRX would face a huge amount of selling pressure between the 50% and 78.6% Fibonacci levels. This suggested that its upwards journey would not be a breeze. To revisit its April highs of $0.157, TRX would need to register a convincing close above the 78.6% Fibonacci level.
On the flip side, a newer low at the baseline can be expected should TRX slip under the confluence of its 38.2% Fibonacci level and 50-SMA (yellow). A potential breakdown can be cut off at the 200-SMA (green), but TRX would be under the severe risk of an extended sell-off if the long-term moving average line fails to withhold bearish pressure.
Reasoning
For the moment, TRX’s indicators remain healthy. The MACD and RSI continued to trade above their respective half-lines. Having said that, there isn’t much bullish momentum in the market yet, as per the Squeeze Momentum Indicator.
The black dots indicated that the market is currently in a squeeze. If this squeeze is released as TRX closes below its short-mid term MAs, a breakdown would become a serious threat.
Conclusion
TRX faced many challenges on its path towards the 78.6% Fibonacci level. A potential double-top pattern and a move above the value high zone could invite selling pressure in the market. The 23.6% Fibonacci level could be TRX’s next destination should sellers take over market proceedings going forward.