Fetch.AI (FET) has failed to break out from a crucial resistance area and could soon break down from its short-term pattern.
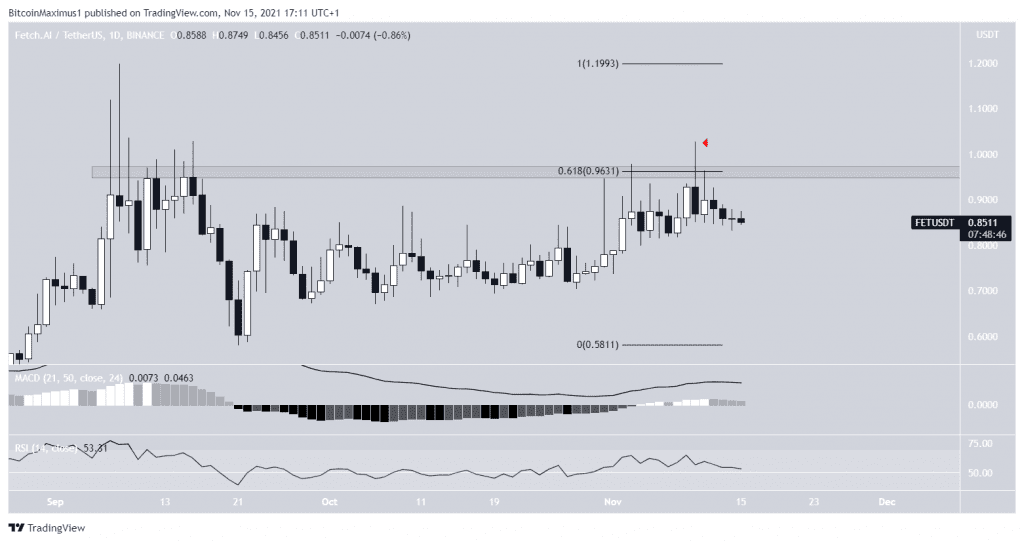
FET has been increasing since Sept 21. The upward movement culminated with a high of $1.02 on Nov 10. However, the token failed to sustain its upward movement and was rejected by the $0.96 resistance area the same day (red icon). This created a long upper wick, which is considered a bearish sign, since it occurs due to selling pressure.
The $0.96 area is extremely important, since it is both the 0.618 Fib retracement resistance level and a horizontal resistance area. When using closing prices, it also acts as the all-time high resistance.
Technical indicator fail to confirm whether FET will break out or resume its short-term descent. The MACD, which is created by a short- and a long-term moving average (MA), is positive but moving downwards. This means that while the short-term MA is still moving faster than the long-term one, it is gradually decelerating.
The RSI, which is a momentum indicator, is at risk of falling below 50. The 50 line is considered a benchmark for a bullish or bearish trend.
Therefore, a look at lower time-frames is required in order to determine the direction of the next movement.

Future movement
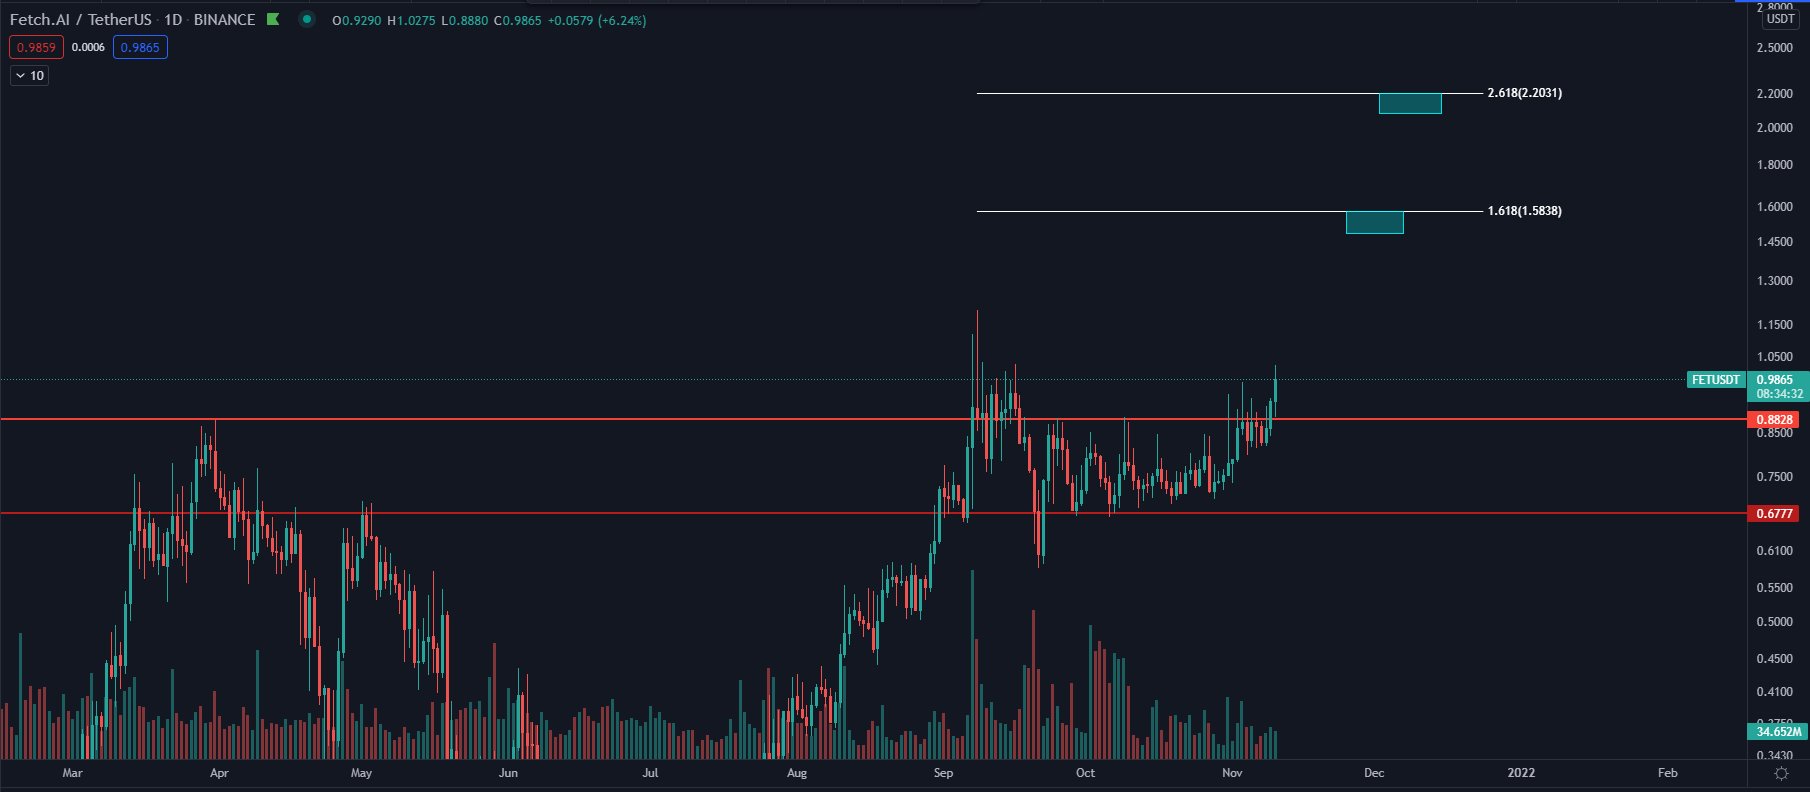
Cryptocurrency trader @DaanCrypto outlined a FET chart, stating that the token could increase to $1.58 and potentially $2.20.

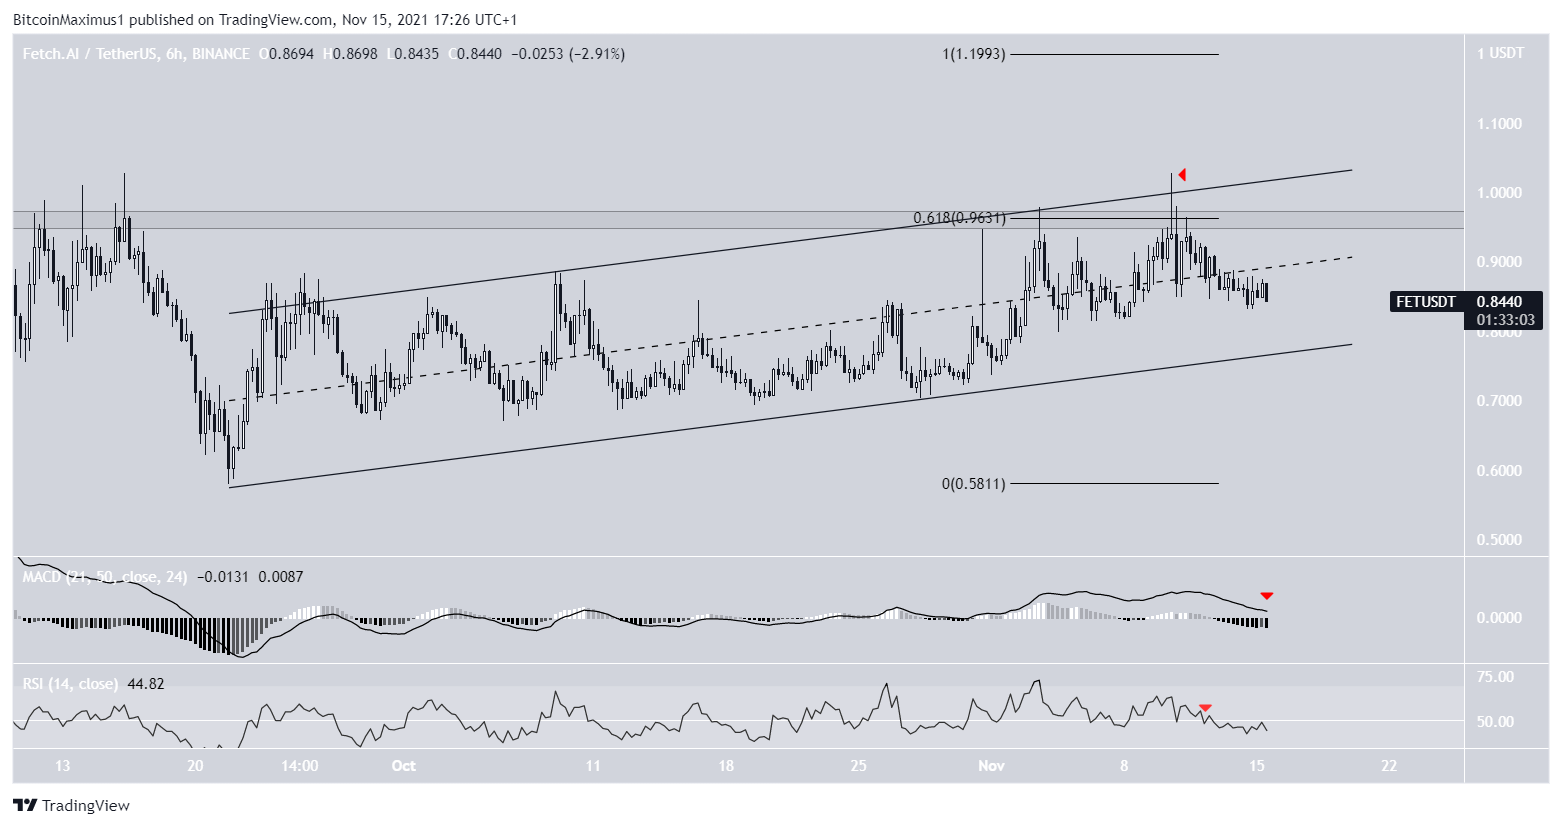
However, the shorter-term six-hour chart shows that FET is trading inside an ascending parallel channel. Such channels usually contain corrective movements. This would mean that a breakdown is likely.
Furthermore, the rejection from the $0.96 area also coincides with a rejection from the resistance line of the channel (red icon), increasing the significance of the bearish pattern.
Also, the RSI is moving downwards and the MACD is nearly negative (red icons).
A breakdown from the channel could lead to much lower prices.
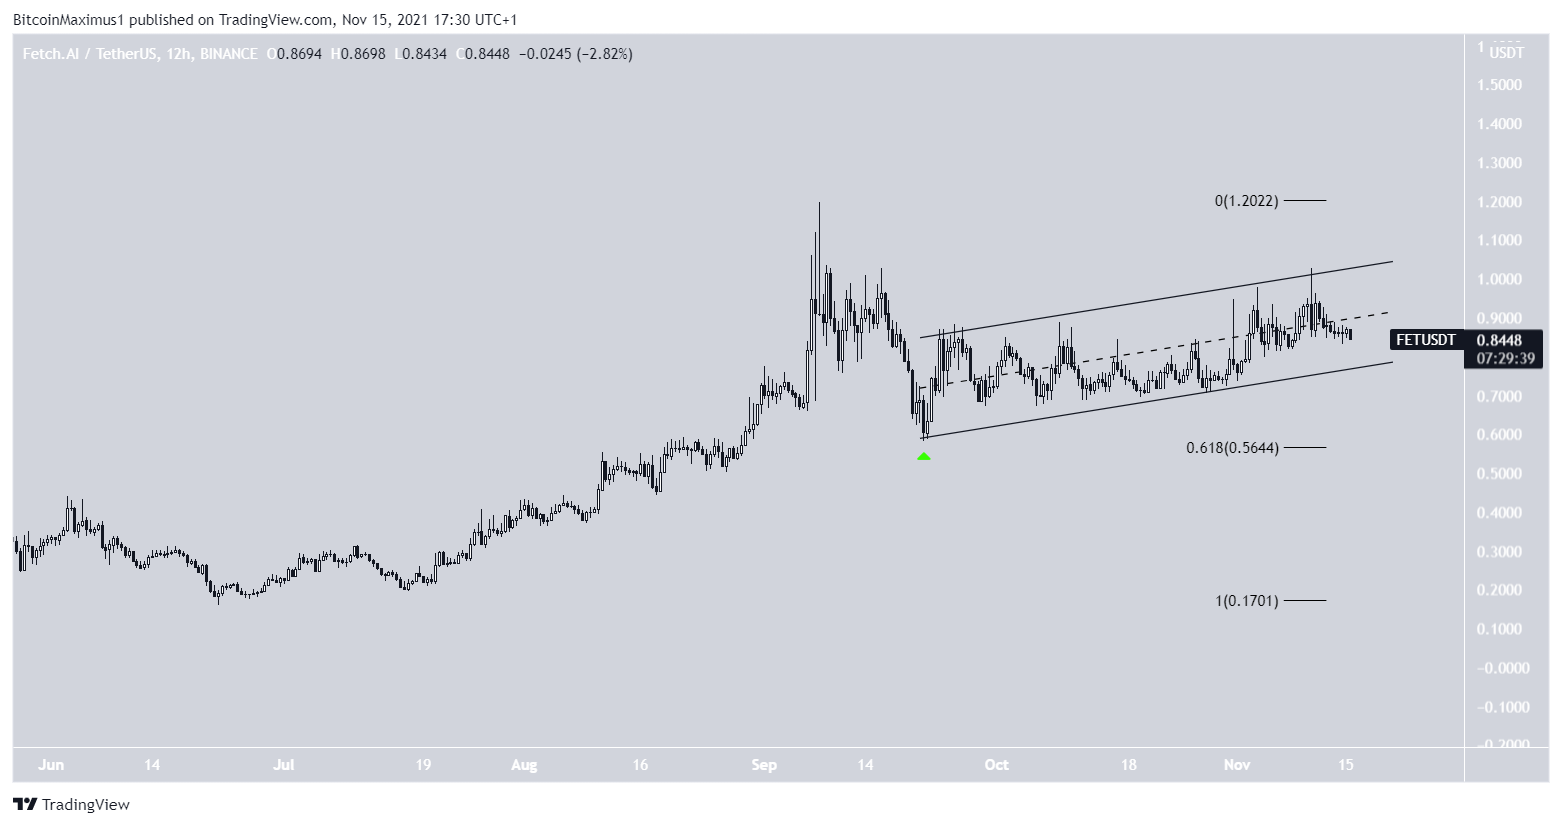
If a breakdown occurs, FET could revisit the 0.618 Fib retracement level support area at $0.56. This would constitute a sweep of the Sept 21 lows (green icon) at $0.58.

For BeInCrypto’s latest Bitcoin (BTC) analysis, click here.
What do you think about this subject? Write to us and tell us!
Disclaimer
All the information contained on our website is published in good faith and for general information purposes only. Any action the reader takes upon the information found on our website is strictly at their own risk.