This 2021 Immutable X (IMX) Technical Analysis is based on the study of technical indicators. Below, we have outlined the key factors that contributed to our Immutable X (IMX) price analysis.
Immutable X is the first layer-2 scaling solution for NFTs on Ethereum, with instant trade confirmation, massive scaling (up to 9,000+ trades per second), and zero gas fees without compromising user custody. StarkWare’s proving technology is used to build the protocol, which allows users to retain access to Ethereum’s ecosystem.
Tokens based on the Immutable X protocol are designed to drive the adoption of NFTs and to enable creators, players, and developers to reimagine value in a digital economy. It is used to earn reward by staking, to pay transaction fees, and to vote on proposals.
A true Layer-2 secured by Ethereum, gas-free and instant trades, self-custody of NFTs, and carbon-neutral NFTs are all available with Immutable X.
Immutable X Current Market Position
According to CoinMarketCap, the IMX is at $6.27 with a 24-hour trading volume of over $87,498,719, at the time of writing this IMX technical analysis. This means the price of IMX has increased by over 10% in the last 24 hours.
Immutable X token has a current circulating supply of 188,160,768.00 IMX. For those interested in buying the token, IMX can be purchased and sold on OKEx, FTX, Huobi Global, Bybit, and Bitget.
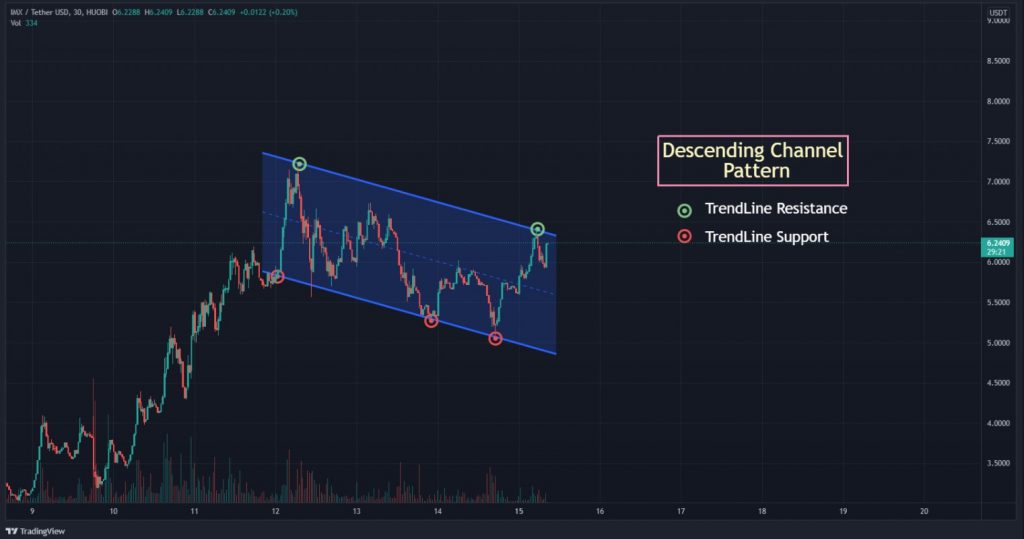
Immutable X Technical Analysis
Currently, Immutable X holds 219th place on CoinMarketCap in terms of market capitalization. Do you think the latest upgrades, changes, and developments in the IMX blockchain can help the crypto’s price to reach higher? Now let’s proceed to the chart in this IMX price prediction article.
The above chart shows the Descending Channel pattern of IMX. This is a bearish pattern which is formed by joining lower highs and lower lows. Based on the graph above, Immutable X was able to defend its position well against the bears in the early days of the month. Currently, IMX is gearing itself for a possible bearish movement in the days to come. If this happens, the crypto might fall. Of course, this is most likely to happen if the bearish market continues to reside with Immutable X.
Conversely, if the bears turn against the crypto, the price of IMX might surge. In short, IMX might break out from its downtrend position and skyrocket to a bullish price.
Immutable X Technical Analysis — MACD, RSI, MA, EMA
When it comes to Moving Average Convergence/Divergence (MACD), the MACD stands just below the signal indicator making a bearish crossover. This represents that traders and investors may expect bearish days ahead. However, if the MACD points towards an upward direction, then we may expect more bullish days ahead.

Furthermore, the Relative Strength Index (RSI) is at level 65.97, this shows that IMX is in nearly overbought state. As a result, traders need to trade safely, as major price reversal could happen soon.

The chart above indicates the 50-day Moving Average and 30-day Exponential Moving Average of IMX. Currently, IMX is in a bullish state. Notably, the IMX price is above 30-MA and 50-EMA, so it is completely in a bullish state. Therefore, there is a high possibility of a trend reversal at any time.
Immutable X Technical Analysis — RVOL, ADX, RVI
Since the start of 2021, IMX’s price has seen many bullish moves which are higher than the previous one. Additionally, those are often followed by consolidations, fluctuations, and corrections right away.
The above chart shows the Relative Volume (RVOL) of IMX. It is an indicator that indicates to traders how the current trading volume has changed over a period of time compared to the previous trading volume. Currently, the RVOL of IMX lies below the cutoff line which indicates the weaker participants in the current trend.Now let’s look at IMX’s Average Directional Index (ADX).

Above, you can see a chart of the Relative Volatility Index (RVI). In detail, RVI calculates standard deviation over a period rather than absolute price changes over that period. RVI is above 50 levels, this indicates the direction of volatility is to the upside.
Conclusion
IMX 2021 technical analysis shows that the cryptocurrency has a fantastic future ahead in 2021. Also, the project looks promising as it has high aims, a use case, and clear goals that target a broad market.
Bullish IMX price prediction 2021 is $15. IMX could also reach a new all-time high price if investors have decided that IMX is a good investment in 2021. Furthermore, together with growing adoption, positive price predictions, and a community composed of thousands of retailers, IMX is likely to be a good investment this year.
Disclaimer: The views and opinions expressed in this article are solely the author’s and do not necessarily reflect the views of CoinQuora. No information in this article should be interpreted as investment advice. CoinQuora encourages all users to do their own research before investing in cryptocurrencies.