Solana (SOL) has broken out from a short-term pattern and is showing signs of a potential upward movement towards a new all-time high price.
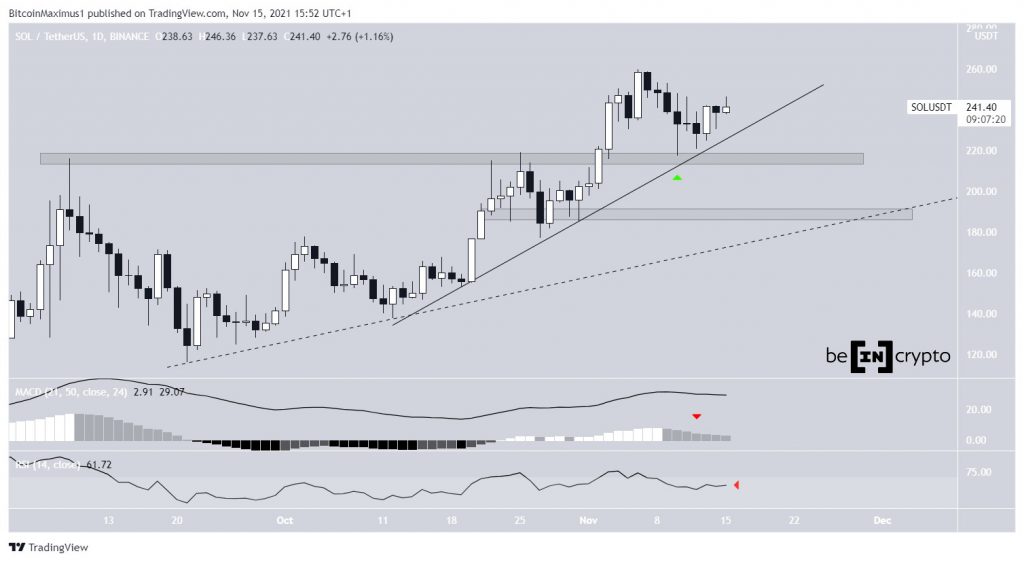
SOL had been moving downwards since reaching a new all-time high price of $259.9 on Nov 6. The decrease led to a low of $217.5 on Nov 10. However, the token bounced afterwards and created a long lower wick (green icon). Such wicks are created due to buying pressure.
The bounce was extremely important, since it served to validate the previous all-time high region of $216 as support. Furthermore, it also validated an ascending support line (solid).
However, technical indicators provide ambiguous readings.
The MACD, which is created by a short- and a long-term moving average (MA), is positive but moving downwards. This means that while the short-term MA is moving faster than the long-term one, it is also gradually decelerating.
Similarly, the RSI, which is a momentum indicator, is decreasing and has fallen below 70. While values above 50 are considered bullish, the ongoing decrease is bearish.
SOL is also following a less steep ascending support line (dashed), which coincides with the horizontal support level at.

Future SOL movement
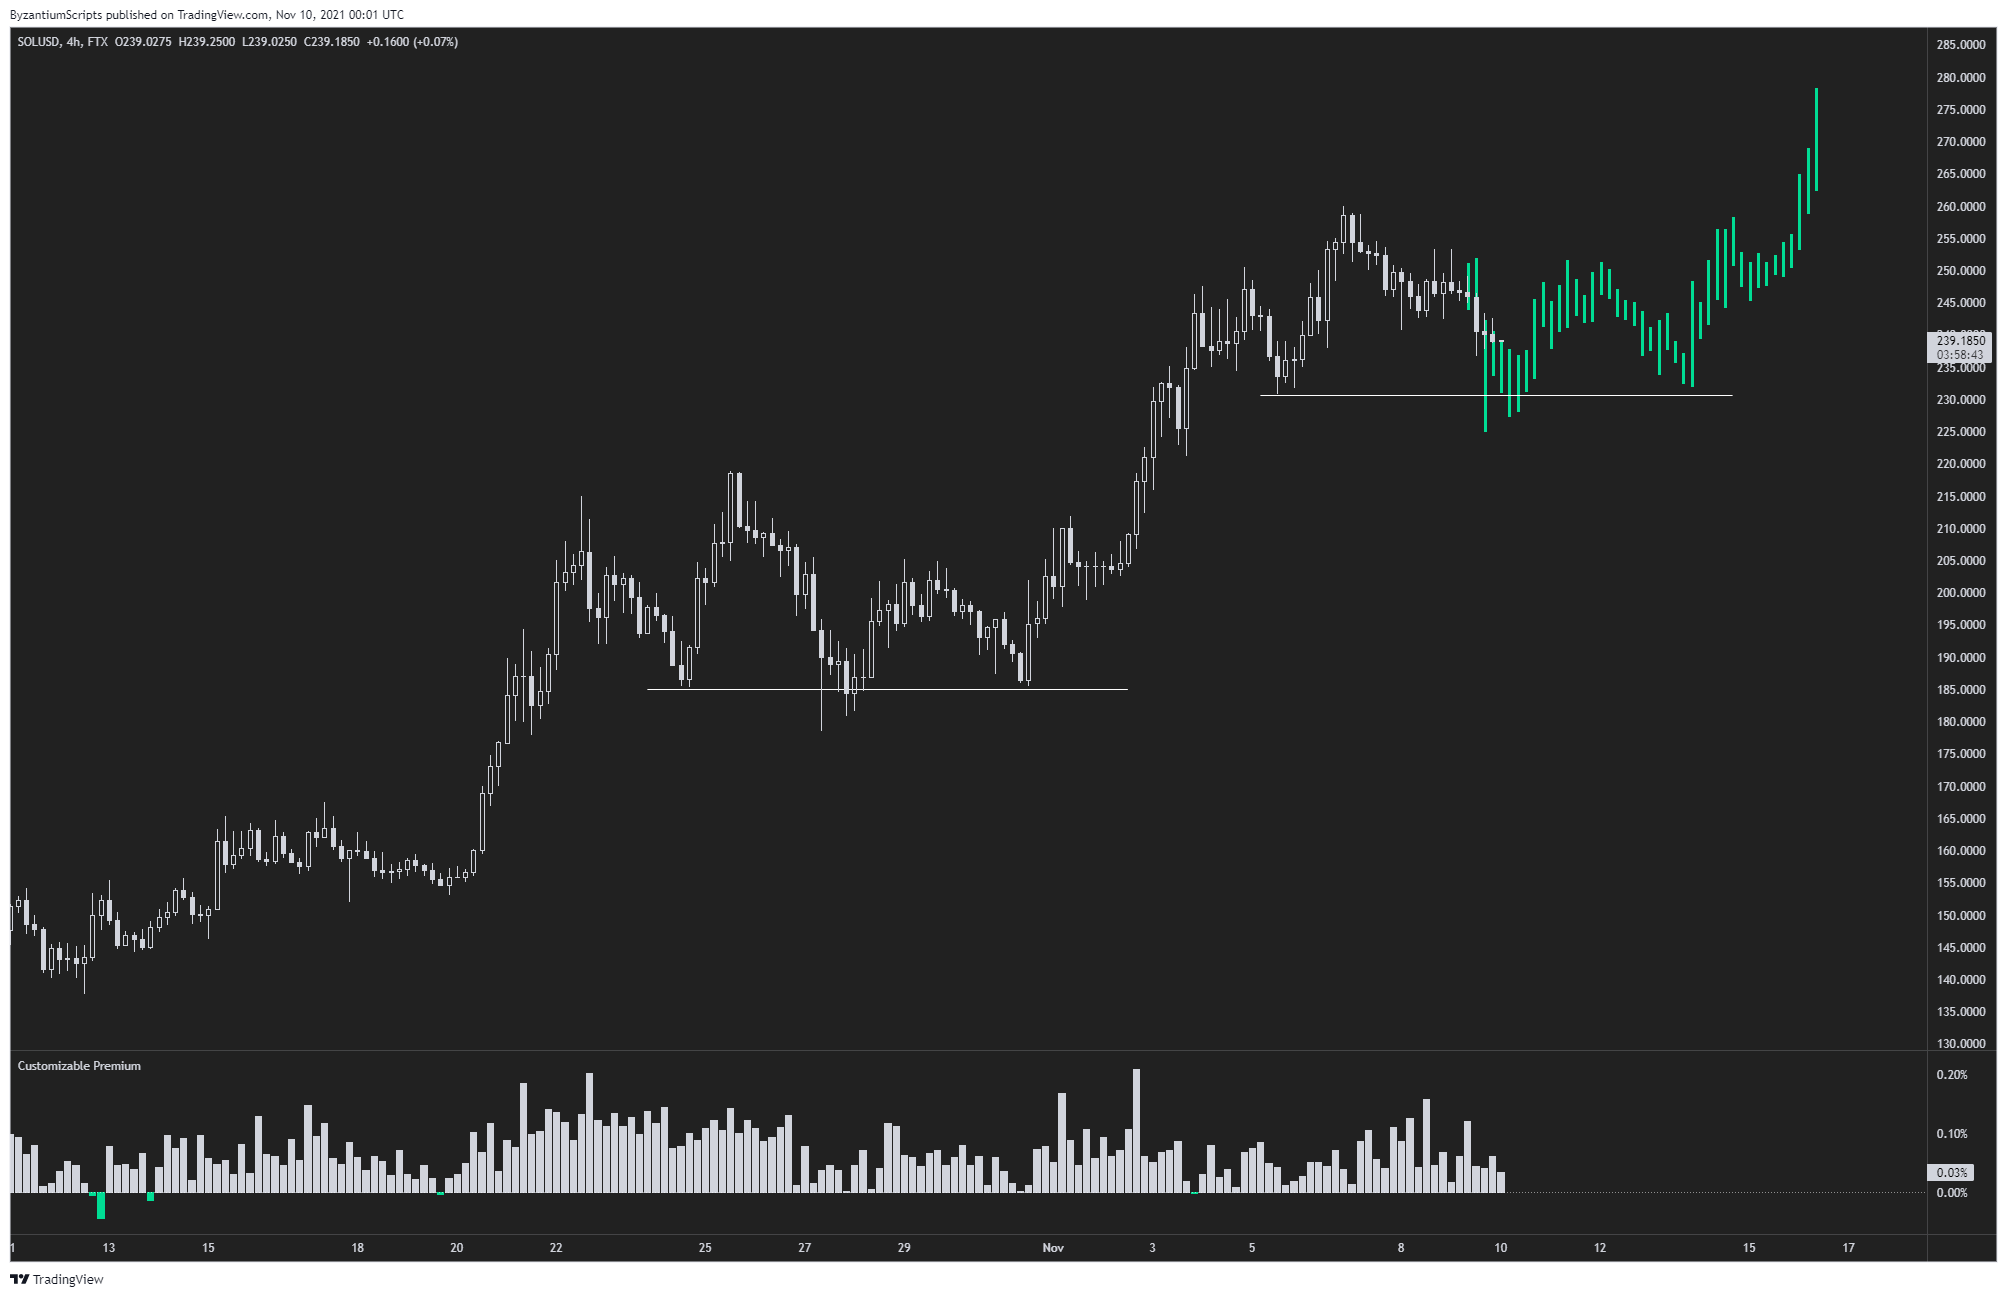
Cryptocurrency trader @ByZGeneral outlined a SOL chart, stating that the token will reach a new all-time high after it is done consolidating.

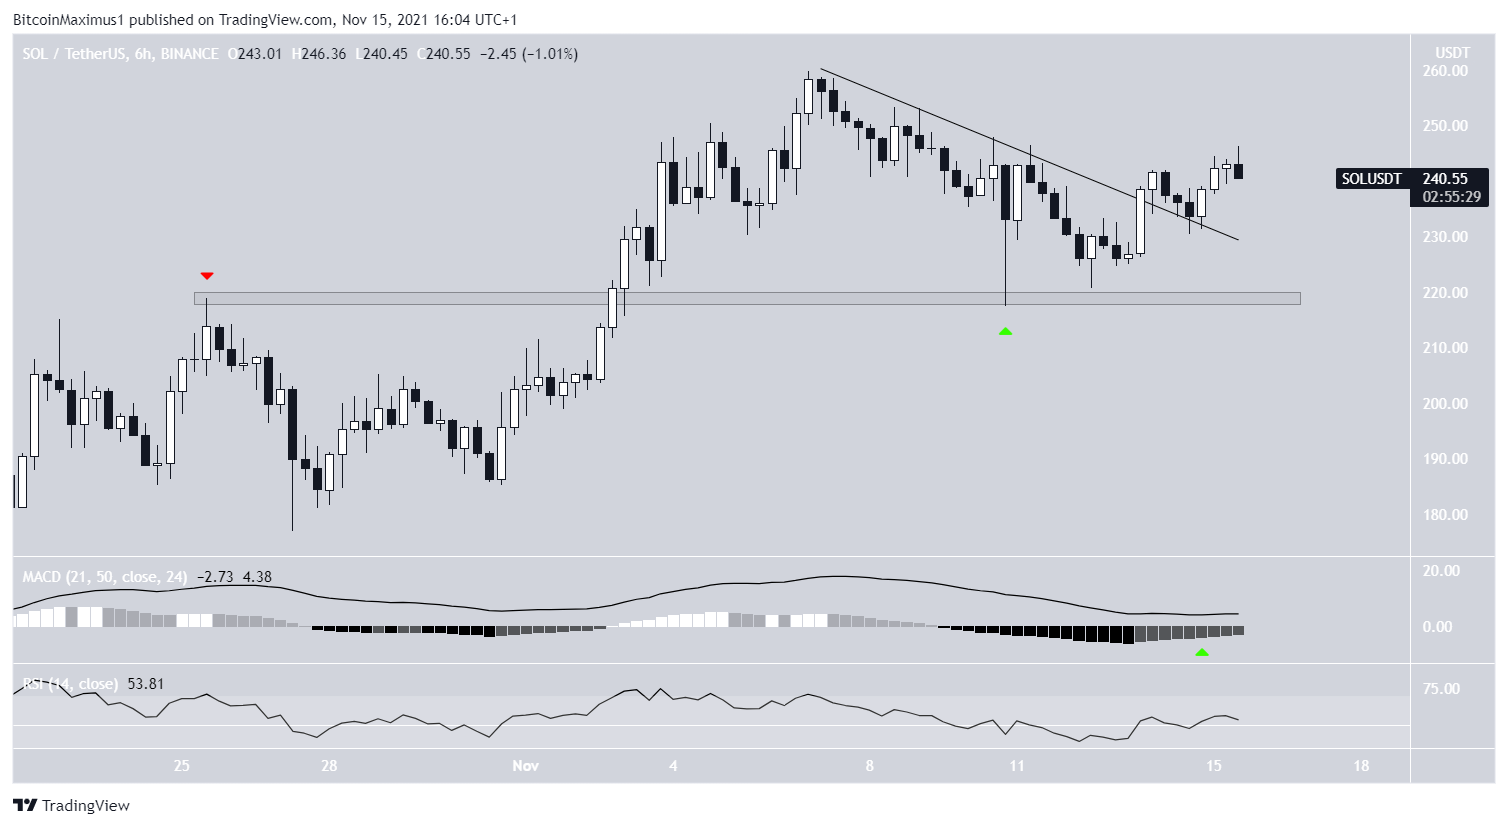
The shorter-term six-hour chart does indeed look bullish. Besides bouncing at the previous resistance (green icon), SOL has broken out from a short-term descending resistance line.
Furthermore, both the MACD and RSI support the continuation of the upward movement. The former is moving upwards and is positive, while the latter has just moved above 50.
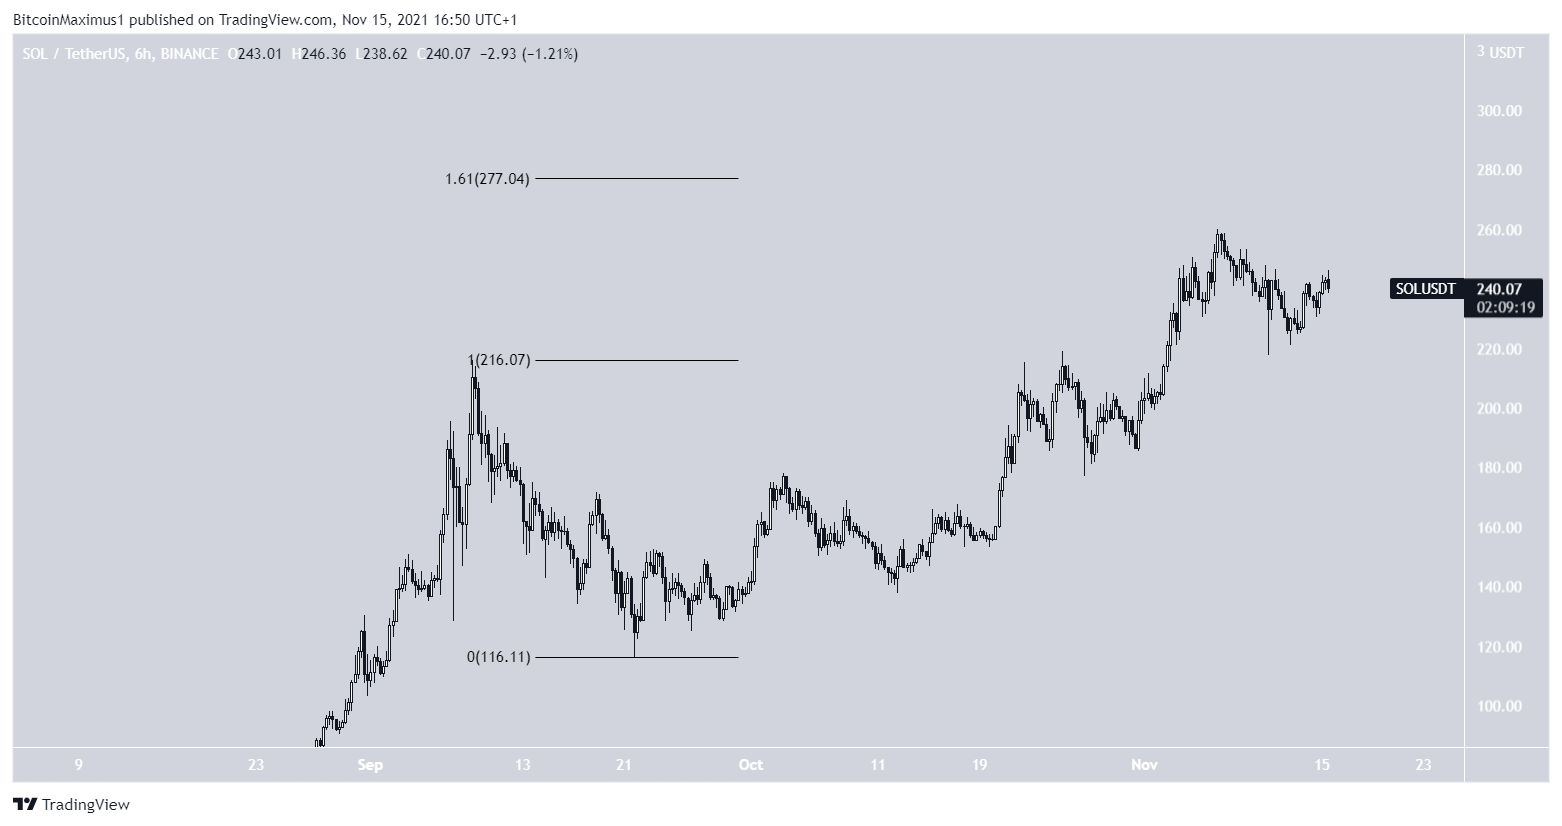
If the upward movement continues, the next closest resistance area would be at $277. This is the 1.61 external Fib retracement resistance level when measuring the previous drop.
Once a token reaches a new all-time high price, such levels are used to find the next resistance areas.

For BeInCrypto’s latest Bitcoin (BTC) analysis, click here.
What do you think about this subject? Write to us and tell us!
Disclaimer
All the information contained on our website is published in good faith and for general information purposes only. Any action the reader takes upon the information found on our website is strictly at their own risk.