The GALA/USD Chart indicated an overall uptrend for this token. Though the GALA price was trapped in consolidation for quite a while, the crypto investors are encouraging the trending industry of metaverse, decentralized games, and NFTs. On November 15th, the GALA token broke out from a crucial resistance of the $0.117 mark, indicating a 30% gain in its intraday session.
Key technical points:
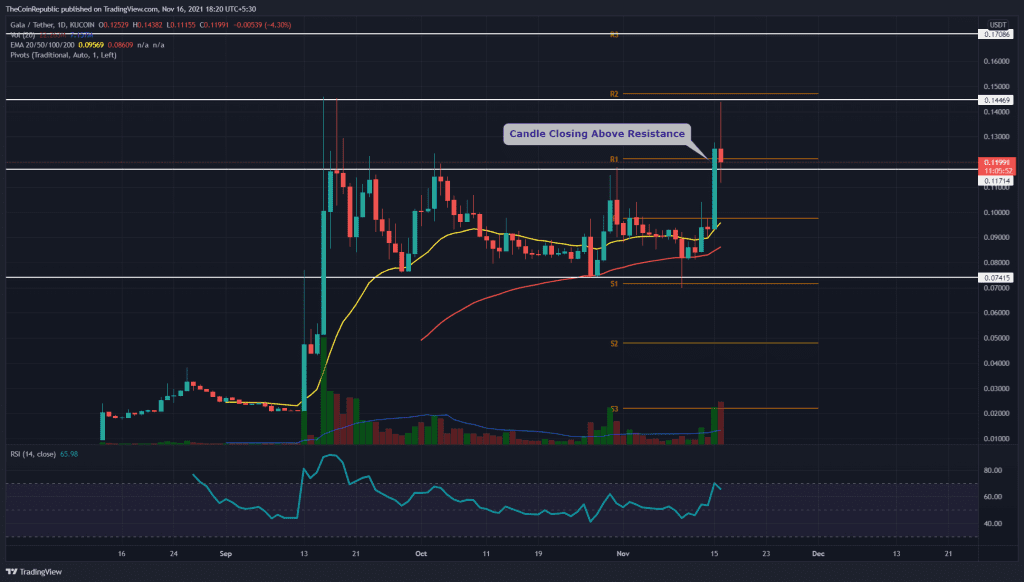
- The GALA token price provides a daily-candle closing above the $0.117 resistance
- The GALA token shows a Cup and handle pattern in a 4-hour time frame chart
- The intraday trading volume in the GALA token is $1.02 Billion, indicating a 435% hike

Source- GALA/USD chart by Tradingview
After giving a remarkable rally in September, the GALA token price entered a consolidation phase. The token kept resonating between $0.117 and $0.74 for almost two months until yesterday, when it finally gave a proper breakout from the $0.0117 resistance.
Before this, the GALA token could never give a daily candle closing above this crucial resistance. Therefore, with this breakout and strong support from the volume activity, the crypto traders can grab a great long opportunity for them.
The crucial EMAs(20 and 50) are in support of the GALA token. Moreover, the Relative Strength Index value at 66 indicates a bullish sentiment for this token.
GALA/USD Chart In The 4-hour Time Frame

Source- GALA/USD chart by Tradingview
The GALA token displayed an additional confirmation for the long trader by forming a Cup and Handle pattern. However, similar to the retest phase in the daily chart, the handle portion of this pattern is yet to obtain proper support from the $0.117 level.
The crypto will get a great long entry opportunity if the price gets sufficient demand pressure from this bottom support. However, these traders can also wait for a $0.145 neckline breakout of this bullish pattern for even better confirmation.
The traditional pivot shows remarkable confluence with the daily MANA/USD chart level. According to these pivot levels, the crypto traders can expect the nearest resistance for this token to be at $0.145, followed by $0.17. As for the opposite end, the support levels are $0.08 and $0.074
.
.