While the longer-term trend remains uncertain, the Bitcoin dominance rate (BTCD) is likely to break out above its short-term resistance.
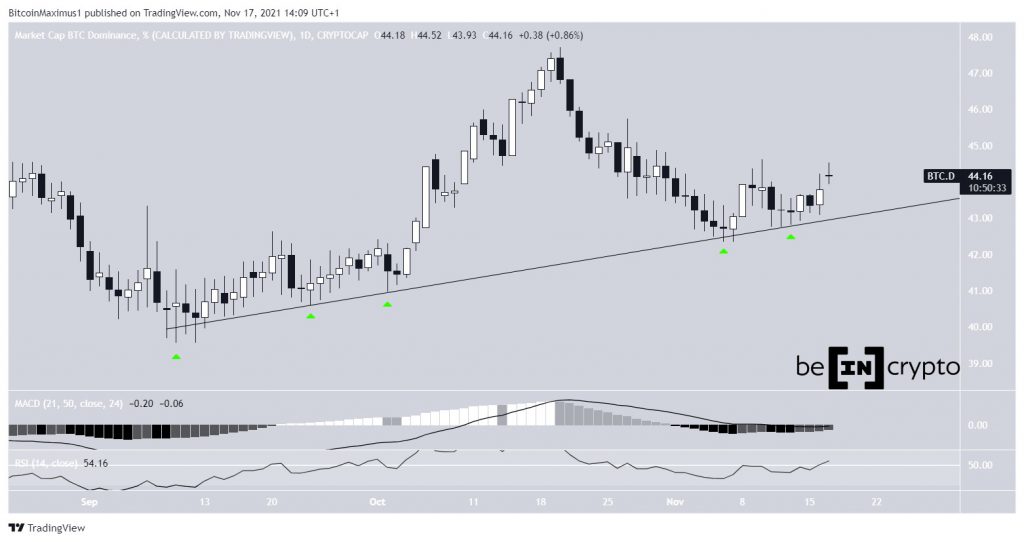
BTCD has been decreasing since Oct 20, when it reached a high of 47.72%. The downward movement continued until Nov 6, when the rate reached a low of 42.37%.
The decreased served to validate an ascending support line for the fifth time (green icons). The line has been in place since the Sept 10 lows. As long as it does not break down, the bullish structure remains intact.
Technical indicators for BTCD are showing bullish signs, but have yet to confirm the bullish trend.
The RSI, which is a momentum indicator, has just moved above 50. If it is able to successfully stay above the line, the movement would be considered a sign of a bullish trend.
The MACD, which is created by a short- and a long-term moving average (MA), is right at the 0 line. This is a sign of a neutral trend. However, its histogram is moving upwards, which means that the line could do the same soon.
Therefore, the daily time-frame is leaning on bullish.

Short-term BTCD movement
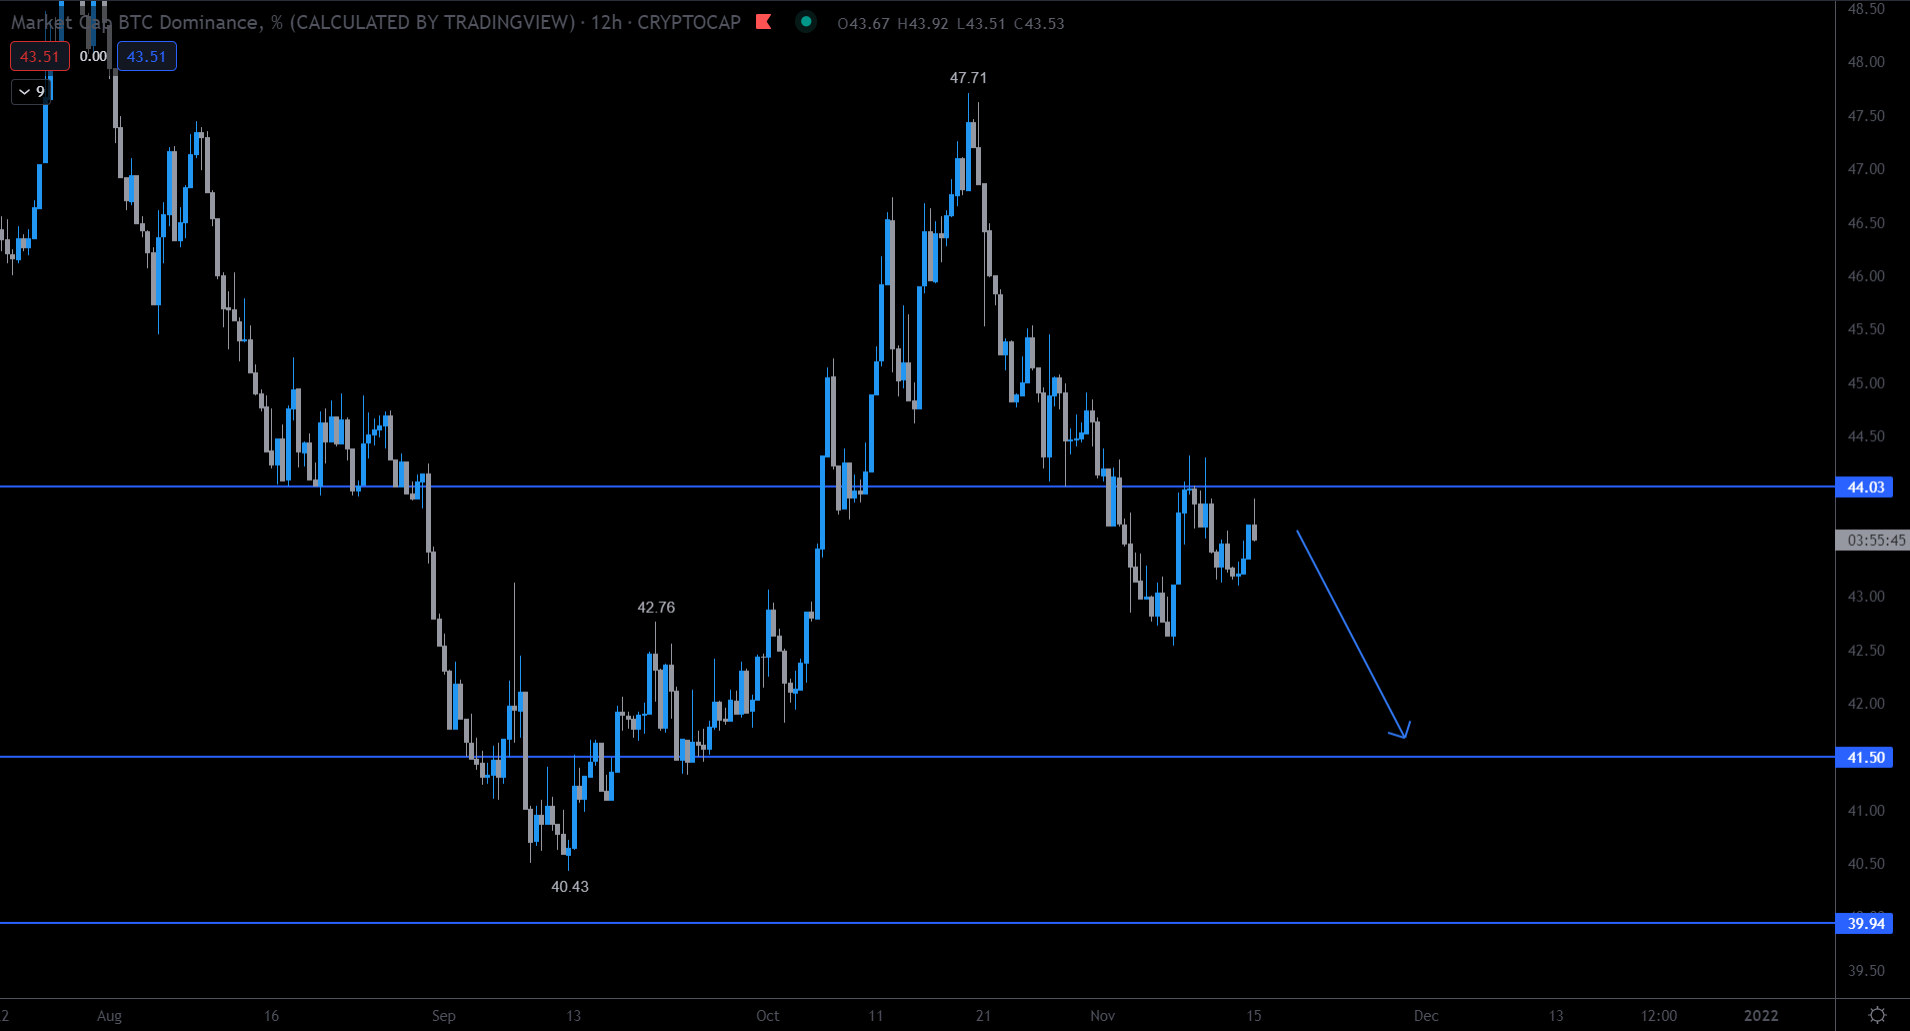
Cryptocurrency trader @TradingTank outlined a BTCD chart, stating that the rate is expected to continue falling towards the 41.50% support level.

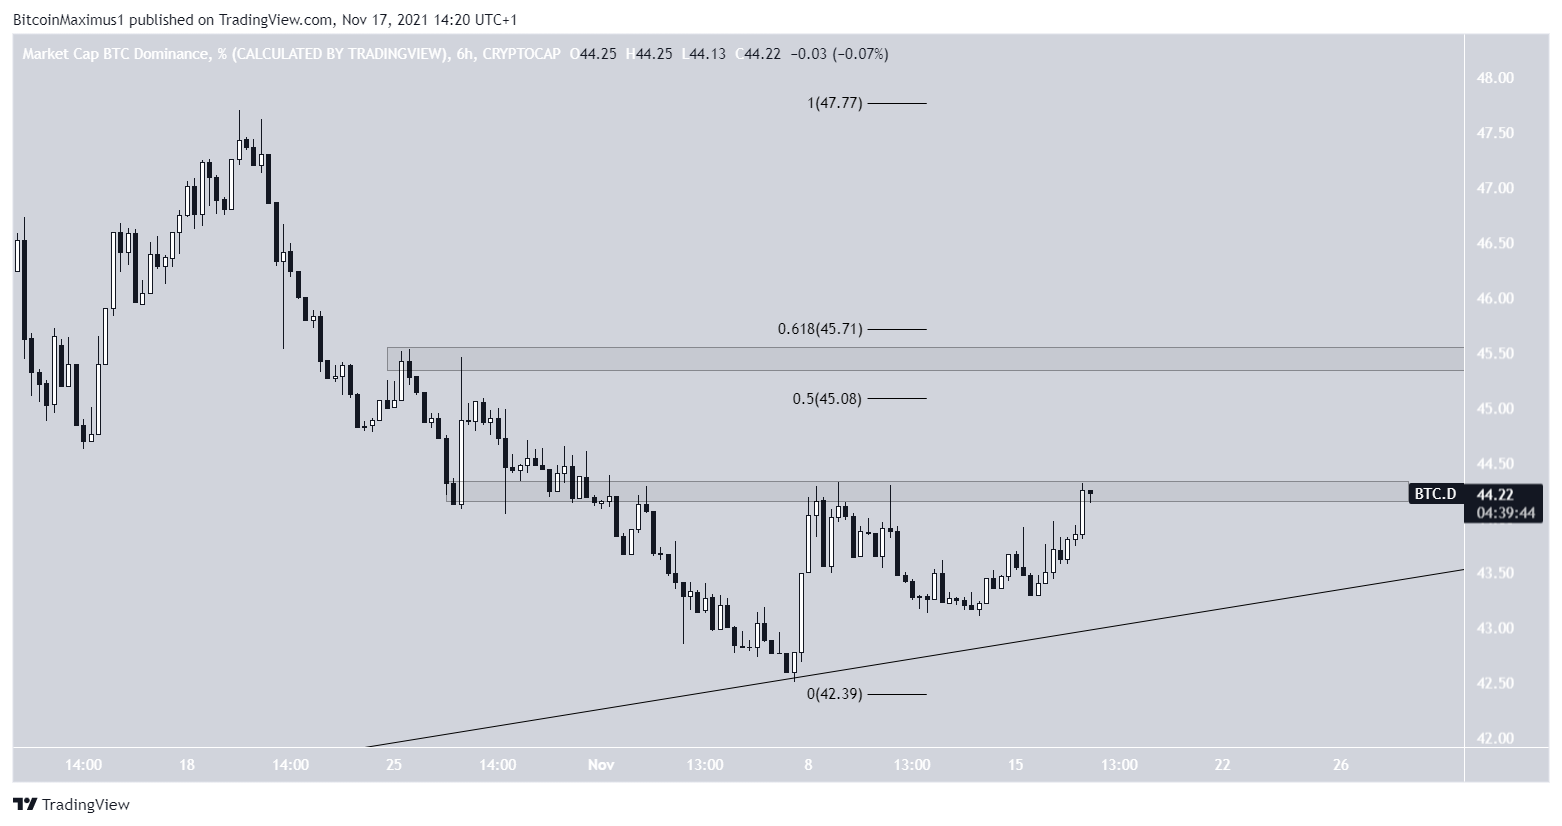
However, BTCD is currently in the process of moving above the 44% minor resistance area, currently making its second attempt at doing so.
If successful, there would be strong resistance at 45.50%. The resistance is created by a horizontal resistance area and the 0.5-0.618 Fib retracement resistance levels.
In order for the bullish reversal to be confirmed, BTCD has to move above these levels.

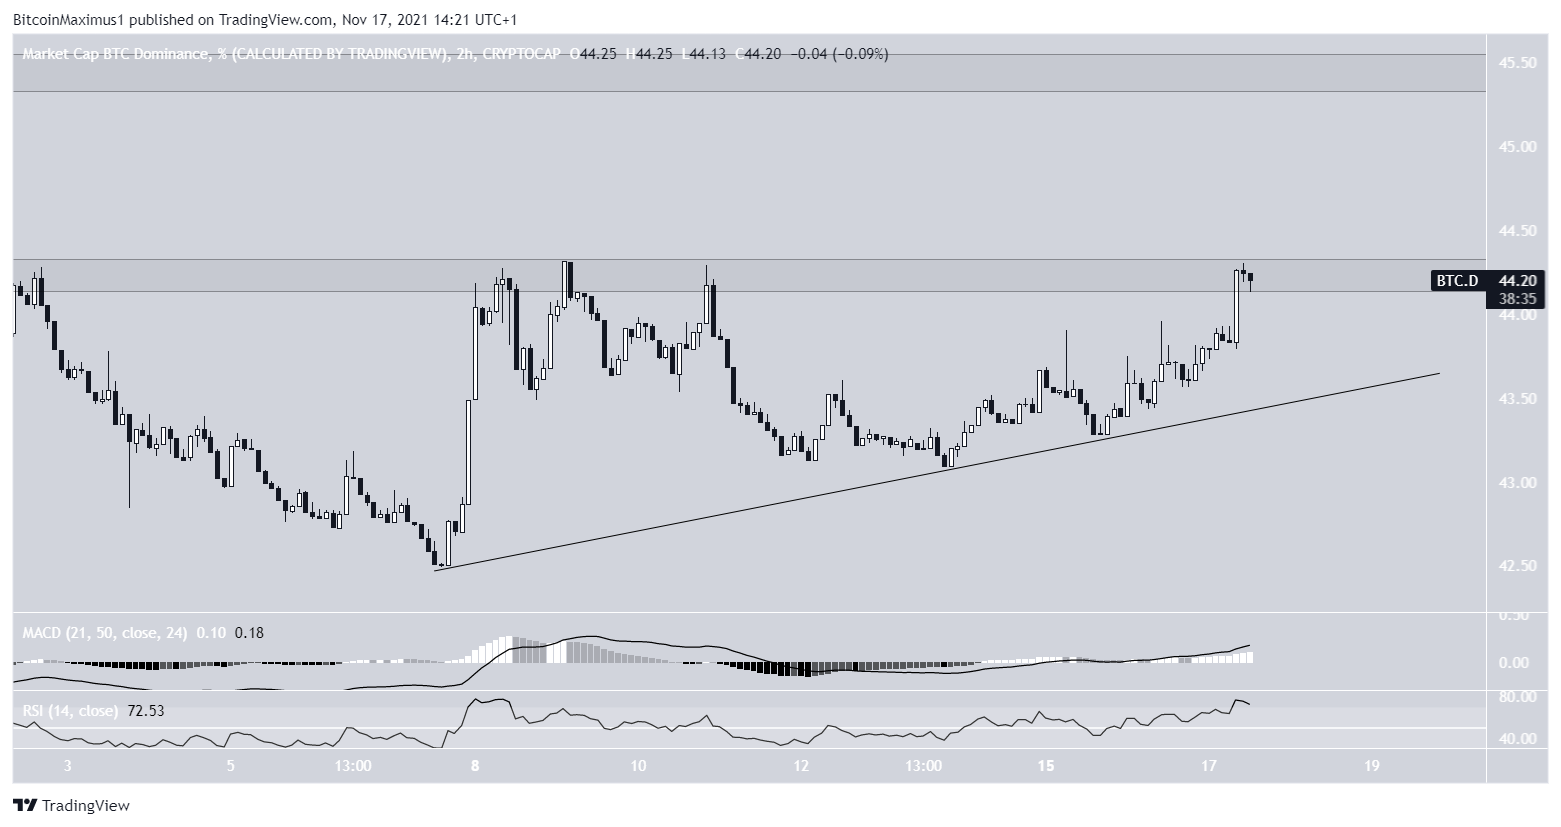
The even shorter-term two-hour chart suggests that BTCD will be successful in doing so. Both the MACD and RSI are increasing and in positive territory. Also, the rate is following another ascending support line, which creates an ascending triangle that is considered a bullish pattern.
Therefore, while the longer-term trend remains unclear, a short-term breakout would be likely. Whether BTCD manages to clear the 45.50% level will likely determine the direction of the future trend.

For BeInCrypto’s latest Bitcoin (BTC) analysis, click here.
What do you think about this subject? Write to us and tell us!
Disclaimer
All the information contained on our website is published in good faith and for general information purposes only. Any action the reader takes upon the information found on our website is strictly at their own risk.