As Bitcoin and most altcoins stifled over the past few days, Dogecoin and Bitcoin Cash touched their three-week low on 16 November. Their near-term technicals inclined in favor of sellers but possibly hinted at a bullish revival.
On the contrary, SAND touched its ATH on 18 November after entering into price discovery. The altcoin registered over 22% increase in 24 hours after displaying bullish technicals.
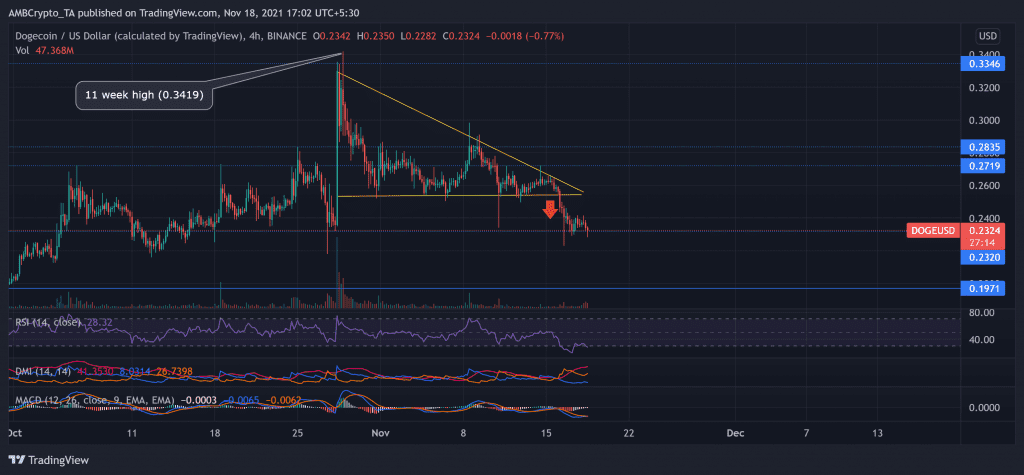
Dogecoin (DOGE)
Since 30 September, DOGE bulls displayed their strength as the meme coin registered a 71.2% monthly ROI. As a result, it touched its 11-week high on 28 October at the $0.34-mark.
But shortly after that, the bears retaliated as the price reversed in a descending triangle. Since then, the bulls failed to counter the sell-off as DOGE lost 34% of its value from 28 October to 16 November.
Over the past two days, bulls strived to gather enough momentum but could not find their edge. Accordingly, at press time, DOGE traded near its immediate support at $0.2324. The RSI visibly depicted an oversold position and no revival signs. Also, the DMI confirmed the bearish preference with a high directional trend. However, MACD reading with the oversold RSI level could trigger a possible bullish revival.
Bitcoin Cash (BCH)

Source: TradingView, BCH/USDT
BCH noted a 46.9% ROI from 30 September to 10 November. As a result, the altcoin touched its nine-week high on 10 November. After which, the bears showed resistance at the upper channel. Consequently, the retreat resulted in a 20.8% retracement over the past eight days.
The bears quickly breached the lower parallel channel and aimed to snap the immediate support at $553.9. As a consequence, the near-term technicals furthered the selling strength. At press time, BCH traded at $578.7.
The RSI stood weak at the 28-mark and did not flash any improvement signs. Further, the DMI confirmed the bearish preference with a high directional trend. Nevertheless, MACD lines were on the verge of a bullish crossover and hinted at some bullish revival signs.
The Sandbox (SAND)

Source: TradingView, SAND/USDT
Since Facebook’s rebranding to Meta, the gaming metaverse token has managed to register exponential gains. From 28 October, SAND saw an exceptional 349% rally as it touched its then ATH on 3 November, quickly after the success of its funding round.
Since then, the price action saw a slight retracement but formed an ascending triangle over the past two weeks. The announcement of Sandbox Alpha possibly became the trigger point for an ascending triangle breakout. Consequently, this rally led SAND into a price discovery mode as it touched its ATH on 18 November.
At press time, the alt traded at $4.2397. The RSI saw a 35 point surge in just two days. This reading visibly depicted a bullish preference. Furthermore, the DMI and MACD resonated with a one-sided bullish bias. However, the overbought RSI and decreasing trading volumes hint at possible ease in bullish vigor.