In this article, BeInCrypto will take a look at on-chain indicators for Bitcoin (BTC) more specifically Net Unrealized Profit/Loss (NUPL). The indicator has yet to reach highs that were reached during previous market tops. Furthermore, it has made a development that last occurred in Sept 2017, slightly prior to the blow-off top that led to the then all-time high of $20,560.
NUPL is an indicator that measures the total amount of profit or loss for investors. A reading below 0 means that the market is in aggregate loss, while one above 0 indicates that the market is in aggregate profit.
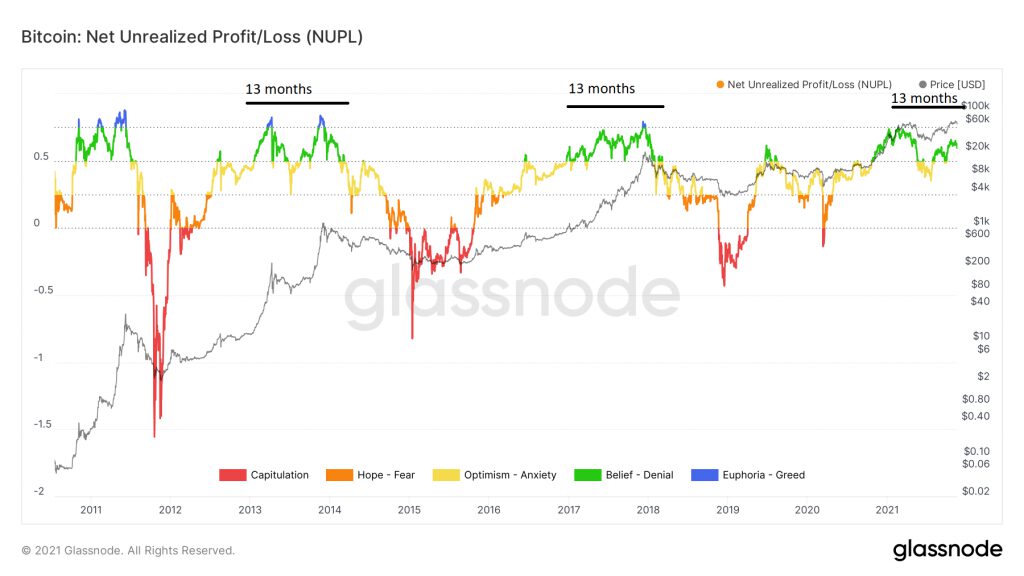
Historically, values above 0.75 (blue) have been associated with tops, while those below 0.25 (red) with bottoms.
Current reading
On Feb 21, NUPL reached a yearly high of 0.748. Compared to the market cycles in 2013 and 2017, it is the only time in which it has not crossed this threshold.
However, measuring from when NUPL first crossed above 0.5, it took 13 months for the top to be reached. Since NUPL crossed above 0.5 on Oct 2020, the same has occurred in the current market cycle.
Therefore, when compared to the previous two cycles, either the current one will be longer, or a top will be reached without a break of the 0.75 line.
Considering that other on-chain indicators suggest that the bull market is just beginning, the former seems more likely.

Short-term NUPL
In the end of May, NUPL fell below 0.5 (blue circle). In the previous NUPL analysis, BeIn crypto stated that “Going by previous history, a decrease below 0.5 could spell the end of the bull market.”
However, the indicator has been moving upwards since and is currently at 0.62. Therefore, the bullish trend remains intact.
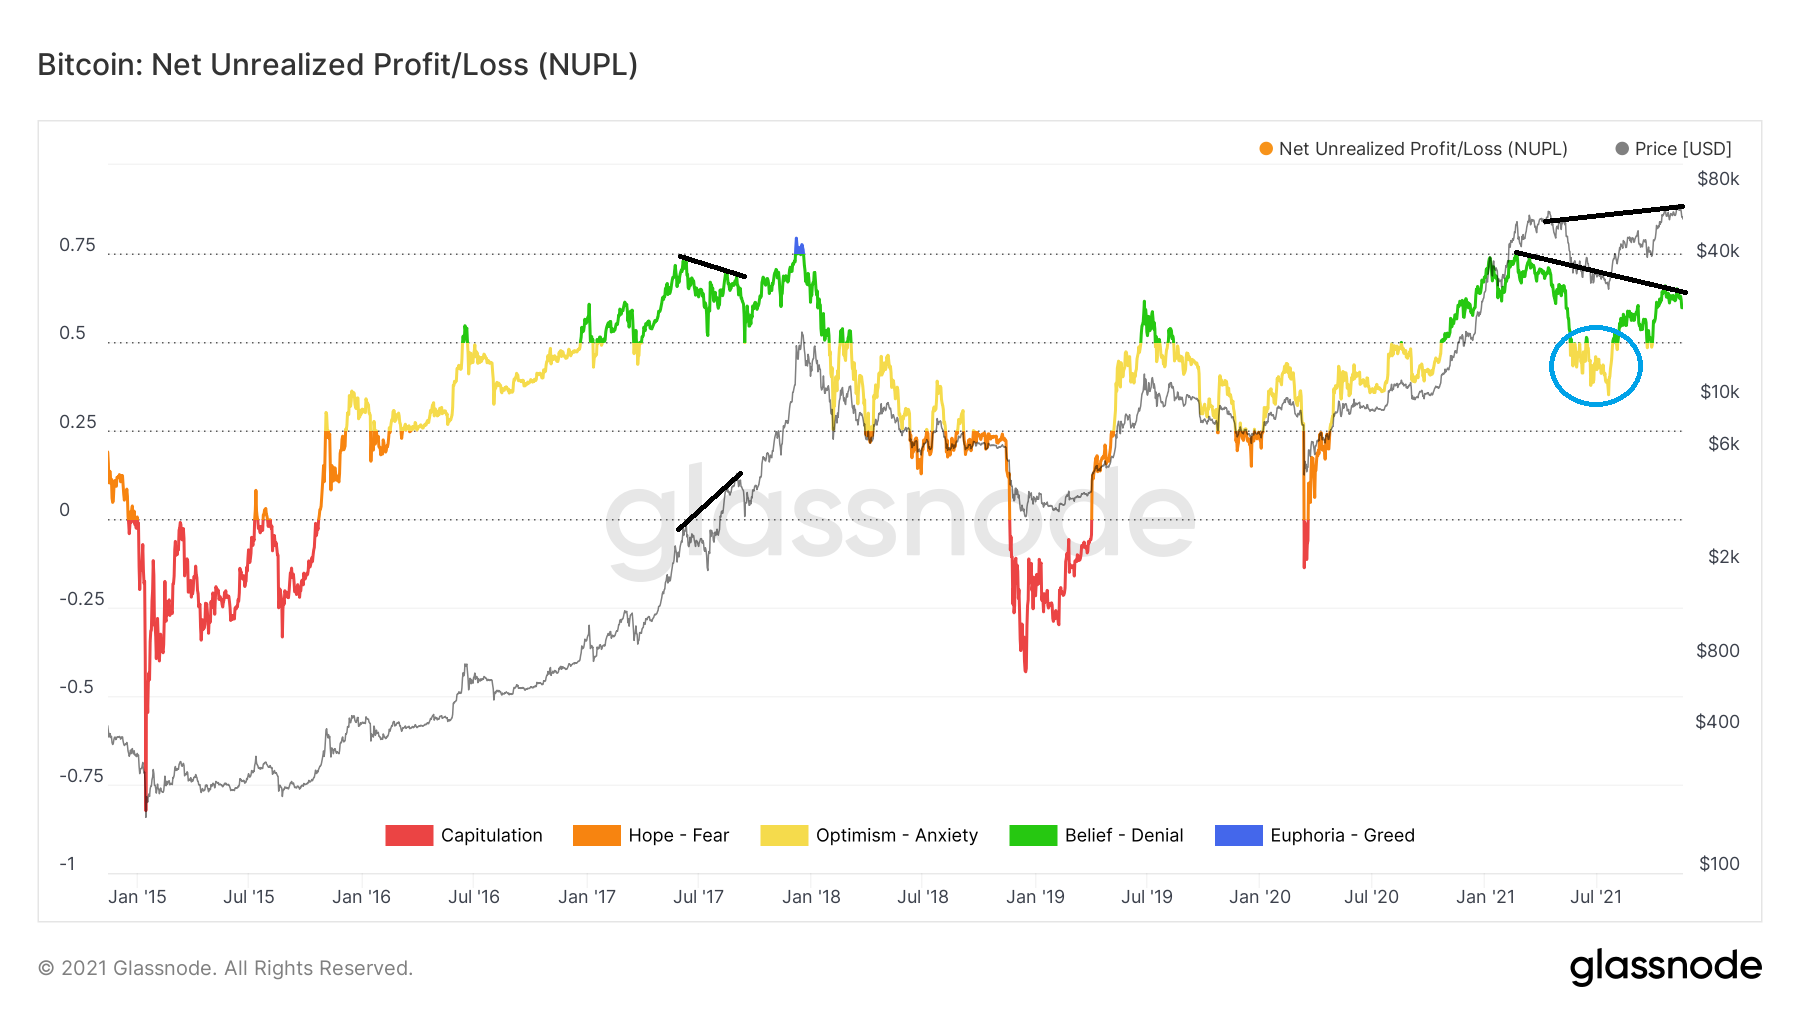
Another interesting development is the lower high in the indicator, while the price has made a higher high. Previously, this has only occurred once (blue line).
This transpired on Sept 2017, just prior to the acceleration of the upward movement towards the then all-time high of 19,800.
For BeInCrypto’s latest Bitcoin (BTC) analysis, click here.
Disclaimer
All the information contained on our website is published in good faith and for general information purposes only. Any action the reader takes upon the information found on our website is strictly at their own risk.