The broader market still struggled to recover from the dynamic flip towards the bearish side.
The bulls dwindled as the bears initiated a heightened sell-off at increasing trading volumes. As a consequence, altcoins like Solana and Chainlink hit their weekly lows on 18 November. Moreover, Ethereum Classic noted double-digit losses after striking its ten-week high on 9 November. Needless to point, the near-term technicals of these cryptos exhibited a bearish inclination.
Solana (SOL)
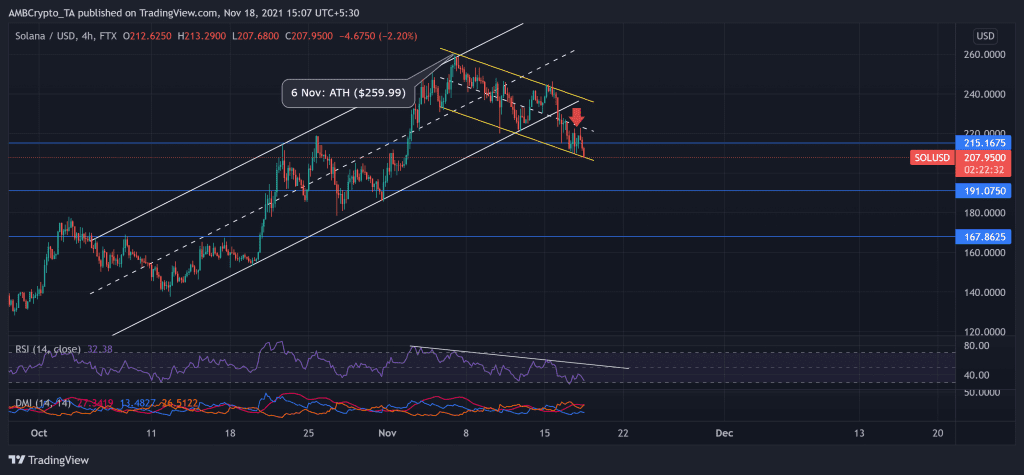
SOL was on a patterned incline between the parallel channels over the past five weeks. The Smart Contract platform’s native token recorded an enormous 85% ROI from 12 October until 6 November. Consequently, the price struck its ATH at the $259-mark on 6 November.
However, since then, SOL has been on a withdrawal as the price descended between parallel channels. This downfall noted an 18.9 % decline and breached the northern trend. Further, the bulls even failed to show resistance at the $215-mark as bears accelerated their vigor.
At press time, SOL traded at its two-week low at $207.95.
The RSI was on a firm downtrend since early November and stood at the 32-mark. This reading convincingly chose the bearish side. Also, the DMI reaffirms the one-sided selling influence.
Chainlink (LINK)

Source: TradingView, LINK/USDT
Since 12 October, the altcoin undertook a bullish trajectory by wavering between parallel channels. Ethereum-based LINK registered a monstrous 62.08% ROI from 12 October to 10 November. As a result, it reached its nearly six-month high on 10 November at $38.31.
However, the bears instantly challenged this achievement as the price reversed below the lower channel after breaching multiple support levels. After a massive sell-off, LINK declined by 26.3% over the next eight days. If the bearish rally sustains, they aim to push immediate support at the $23-mark.
At press time, LINK traded near its one-month low at $27.97. The RSI was deep into the oversold region after a steady downtrend. Further, the DMI and AO corresponded with the constant increase in bearish strength.
Ethereum Classic (ETC)

Source: TradingView, ETC/USDT
Over the past ten weeks, ETC oscillated around the bounds of the $44 and $60-mark. After touching its 14-week low on 27 October, the price action bounced back between that range. The bulls accelerated the price by 39.6% to poke its ten-week high on 9 November at $65.31.
However, since then, the bulls have lost their edge. The price declined by 26.76% to touch its three-week low on 16 November. Afterwhich, the bulls attempted a revival but could not back it up with high trading volumes. Also, the near-term indicators complemented the analysis by suggesting a bearish preference.
At press time, ETC traded at $49.43. The RSI was around the oversold territory and did not show revival signs. Additionally, the DMI and AO resonated with the increased bearish vigor.