Chainlink has laid the ground for a recovery following an oversold RSI and a bullish crossover on the MACD. A move above the 4-hour 20-SMA and 38.2% Fibonacci level would open a route towards the $34-mark, provided bulls are able to successfully negotiate past certain swing highs at $30 and $31.5.
At the time of writing, LINK traded at $27.9, down by 1.8% over the last 24 hours.
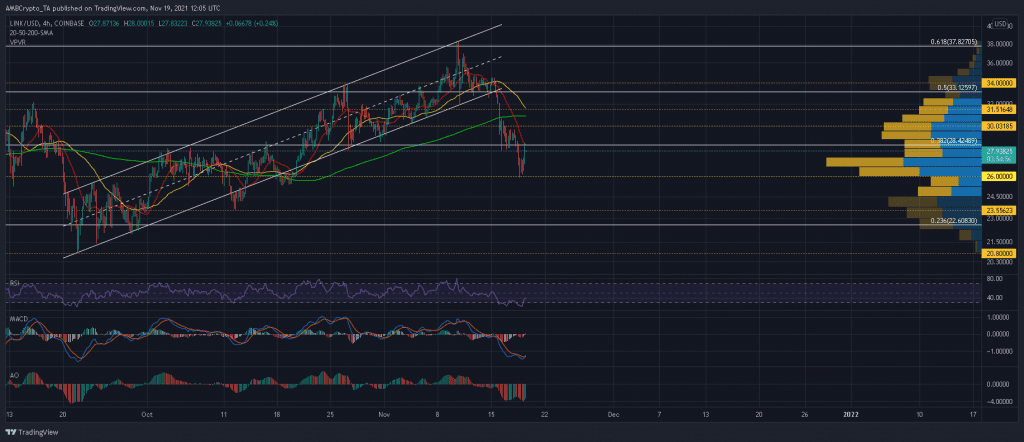
Chainlink 4-hour Chart
Chainlink attempted a revival after an up-channel breakdown triggered a 22% sell-off between 15-18 November. Although $26-support offered momentary relief, LINK needed to smash past its 20-SMA (red) and 38.2% Fibonacci level to rebuild its price.
The region between $30-$31.5 also posed some challenges since the 50-SMA (yellow) and 200-SMA (green) posed as resistance. Expect a round of consolidation within this zone as buyers and sellers battle for market control. From there, a move above 27 October’s swing high of $34 would flush out the remaining sell pressure and allow for an uptrend to emerge.
On the flip side, LINK would be exposed to another 10%-22% decline should its price weaken below $26. Bulls would look to introduce new longs at defensive lines of $23.5 and $20.8.
Reasoning
LINK’s comeback was backed by a bullish crossover on the MACD and a double top on the Awesome Oscillator. The RSI’s oversold nature also demanded a quick revival. However, keep in mind that each indicator was yet to recover above their respective mid-lines and traders must be cautious of setting up early long trades.
Conclusion
LINK faced some stiff challenges on its path of recovery. The 20-SMA (red) and 38.2% Fibonacci level were LINK’s immediate hurdles, while a resistance area between $30-$31.5 could threaten to disrupt LINK’s uptrend. Hence, traders must hold off on long trades till LINK closes above 27 October’s swing high of $34.