The LTO coin price shows a parabolic rally in the last few weeks, presenting a high of $185% for this month. The coin price was rejected from the $0.75 resistance and revealed that it is forming a Cup and handle pattern. If the coin breaks out from the pattern’s neckline, its price should initiate a significant rally.
Key technical points:
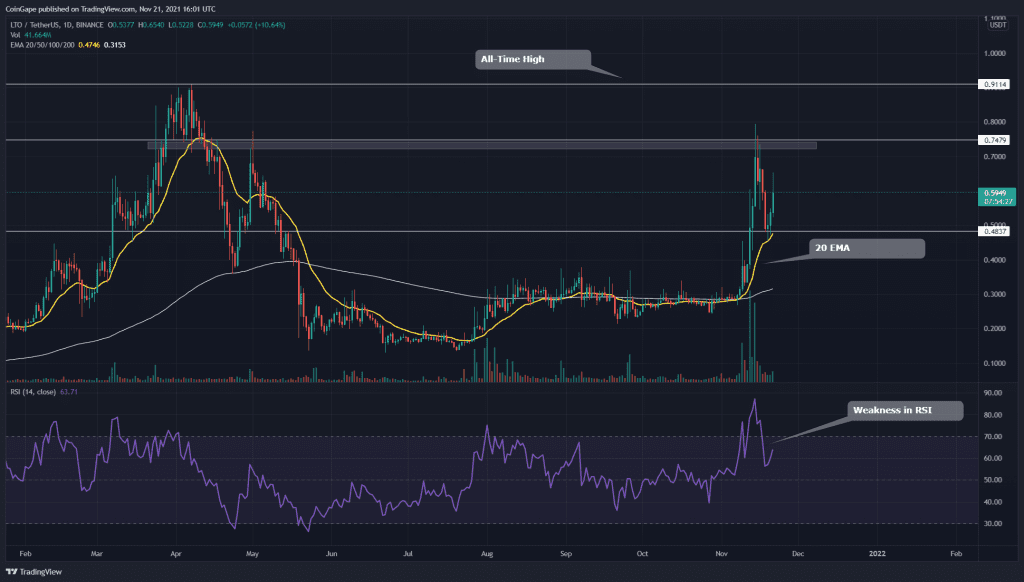
- The LTO coin’s daily RSI chart shows a striking drop in its value
- The LTO price obtains strong support from the 20-day EMA line
- The intraday trading volume in the LTO coin is $71.2 Million, indicating a 192.5% gain

Source- LTO/USD chart by Tradingview
The LTO coin has shown remarkable growth this month as the price is currently trading 110% high from the month’s low. This rally experienced strong rejection from the $0.75 and initiated a correction phase.
However, the bigger picture shows the coin is forming a Cup and Handle pattern in the daily time frame chart. The coin chart indicates the base for the pattern’s handle portion is at $0.48.
According to crucial EMAs(20, 50, 100, and 200), the overall trend of this coin is strongly bullish. Moreover, the 20 EMA line is providing good support to the price.
The Relative Strength Index(63) indicates the coin is under a bullish sentiment. However, the RSI line lost too much of its value in this minor correction, suggesting weakness among the market buyers.
LTO/USD Chart In The 4-hour Time Frame

Source- LTO/USD chart by Tradingview
The LTO coin indicates a V-shaped recovery phase in its price in the lower time frame chart, indicating a strong buying pressure. The coin is currently approaching the overhead neckline resistance of the $0.748 mark, which the price needs to reclaim to complete this pattern.
If the price sustained that bullish breakout, the coin should build up enough bullish momentum to rechallenge the All-Time High resistance of $0.91 and maybe even break out from it.
The MACD indicator shows that both signal and MACD line is about jump above the neutral zone, indicating a bullish momentum for the coin.