The on-chain indicator Puell Multiple shows Bitcoin miners don’t have much incentive to sell at the current price level.
Puell Multiple Values Are Still Relatively Low At The Current Level
As pointed out by a CryptoQuant post, Puell Multiple values are still not too high, implying miners may not feel pressure to sell at the current price level.
The “Puell Multiple” is a famous Bitcoin indicator that estimates how much profit mining pools are currently in compared to the one year historical average.
The metric’s value is calculated by taking the ratio between the daily value of an issued coin and the 365-day moving average of the same.
With the help of the indicator, it becomes possible to know whether miners are likely to sell at a particular level or not.
When the Puell Multiple assumes very high values, the price usually starts to top out as miners sell off their Bitcoin. On the other hand, low values may be seen during periods of bottoms.
Related Reading | Does Taproot Actually Enable Smart Contracts On Bitcoin? The Debate Rages On
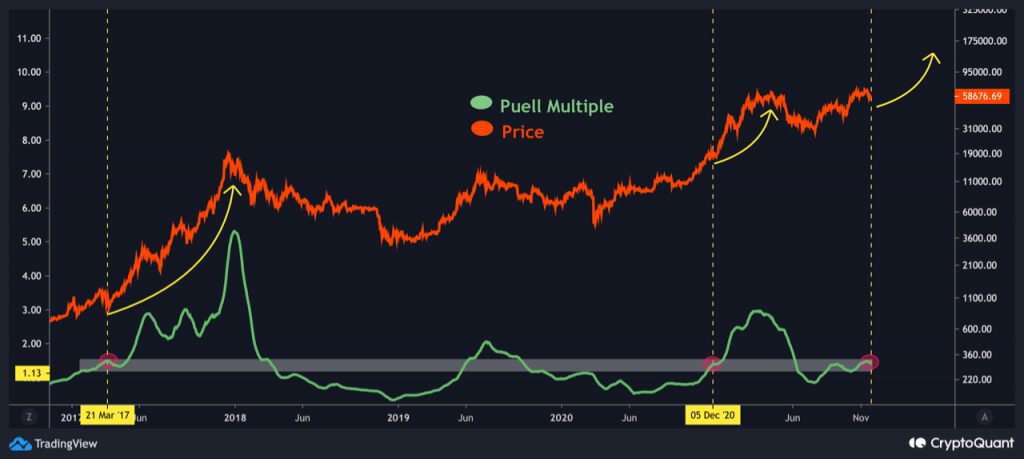
Now, here is a chart that shows the trend in the value of the indicator over the past few years:

The Puell Multiple seems to be relatively low at the moment | Source: CryptoQuant
As the above graph shows, the peaks formed by the indicator seem to have coincided with the tops in Bitcoin price.
Related Reading | This Metric Suggests Bitcoin Miners Rarely Catch The Cycle Top
However, the current Puell Multiple values are still relatively low despite the recent rise in the price of the cryptocurrency.
During May, when Bitcoin was in the same price levels as it is now, the indicator’s values were much higher. This may imply that miners feel much less pressure to sell right now than they did the last time BTC hit $65k.
Bitcoin Price
At the time of writing, BTC’s price floats around $58.9k, down 10% in the last seven days. Over the past thirty days, the crypto has lost 3% in value.
The below chart shows the trend in the price of Bitcoin over the last five days.

BTC's price mostly moves sideways in the past few days | Source: BTCUSD on TradingView
After setting a new all-time high around $69k, Bitcoin has drifted downwards, reaching as low as $55k. The coin has showed no signs of recovery yet as it has mostly consolidated in the past few days. It’s unclear at the moment when the coin might break out of this range bound environment, or which direction it might go in.
However, if the Puell Multiple is anything to go by, the coin may not have yet formed a top, and could still have potential to grow before a real peak.
Featured image from Unsplash.com, charts from TradingView.com, CryptoQuant.com