Binance Coin (BNB) has regained its footing after a nearly two week decrease and could soon make an attempt at reaching a new all-time high.
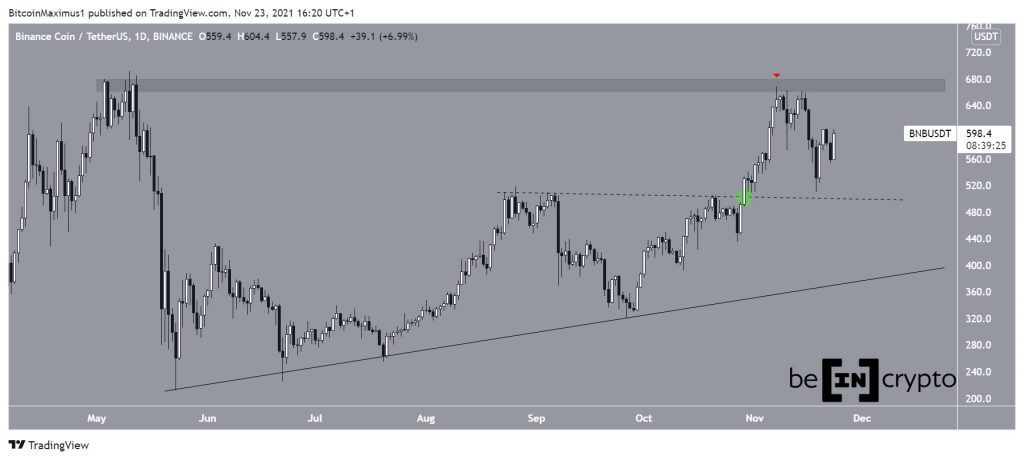
BNB has been increasing alongside an ascending support line since May 23. The upward movement was initially swift, but the token stagnated in the period from late Aug to late Oct.
However, the increase accelerated after BNB broke out (green circle) from a descending resistance line (dashed). This nearly led to a new all-time high price, culminating with a high of $669 on Nov 7 (red icon).
However, it was rejected by the $670 resistance area (red icon) and has been decreasing since.

Cryptocurrency trader @TradingTank outlined a BNB chart, stating that the token has made a double bottom and could increase towards the Nov highs at $670.
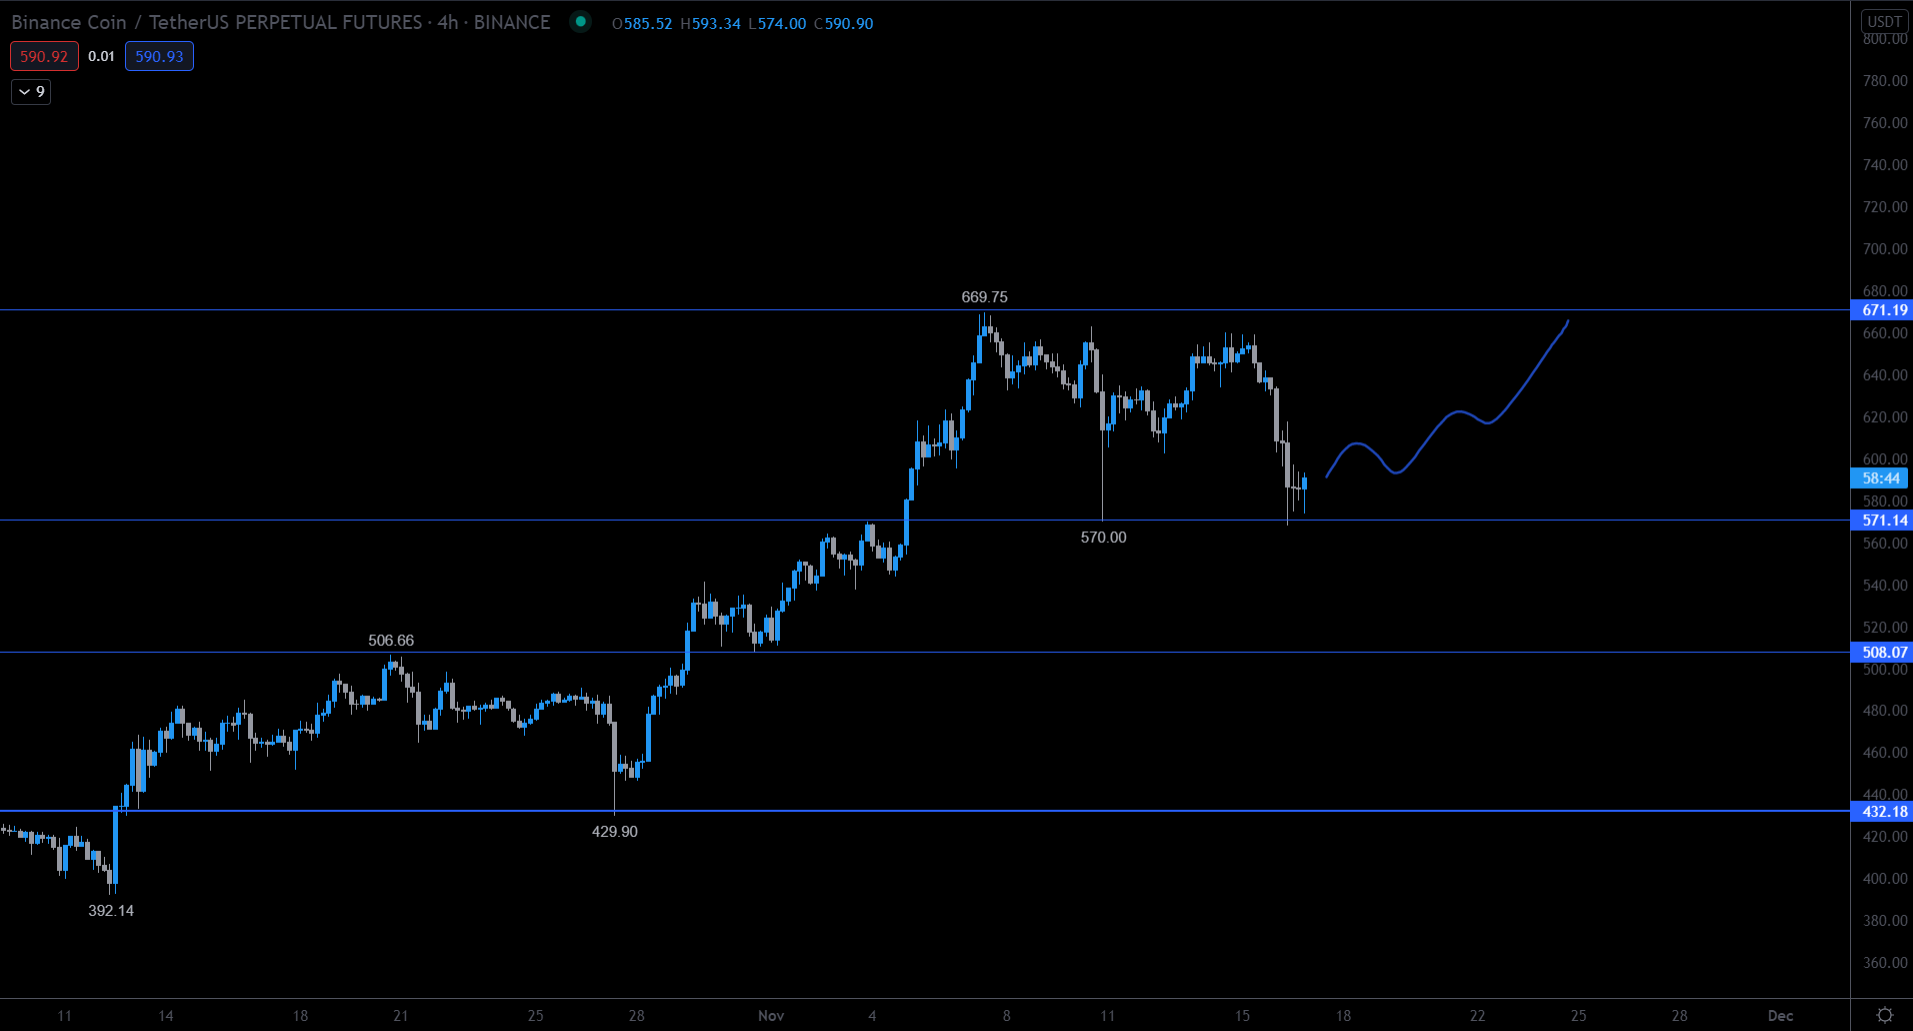

Since the tweet, the token made an attempt at breaking out but was rejected from this resistance.
Future BNB movement
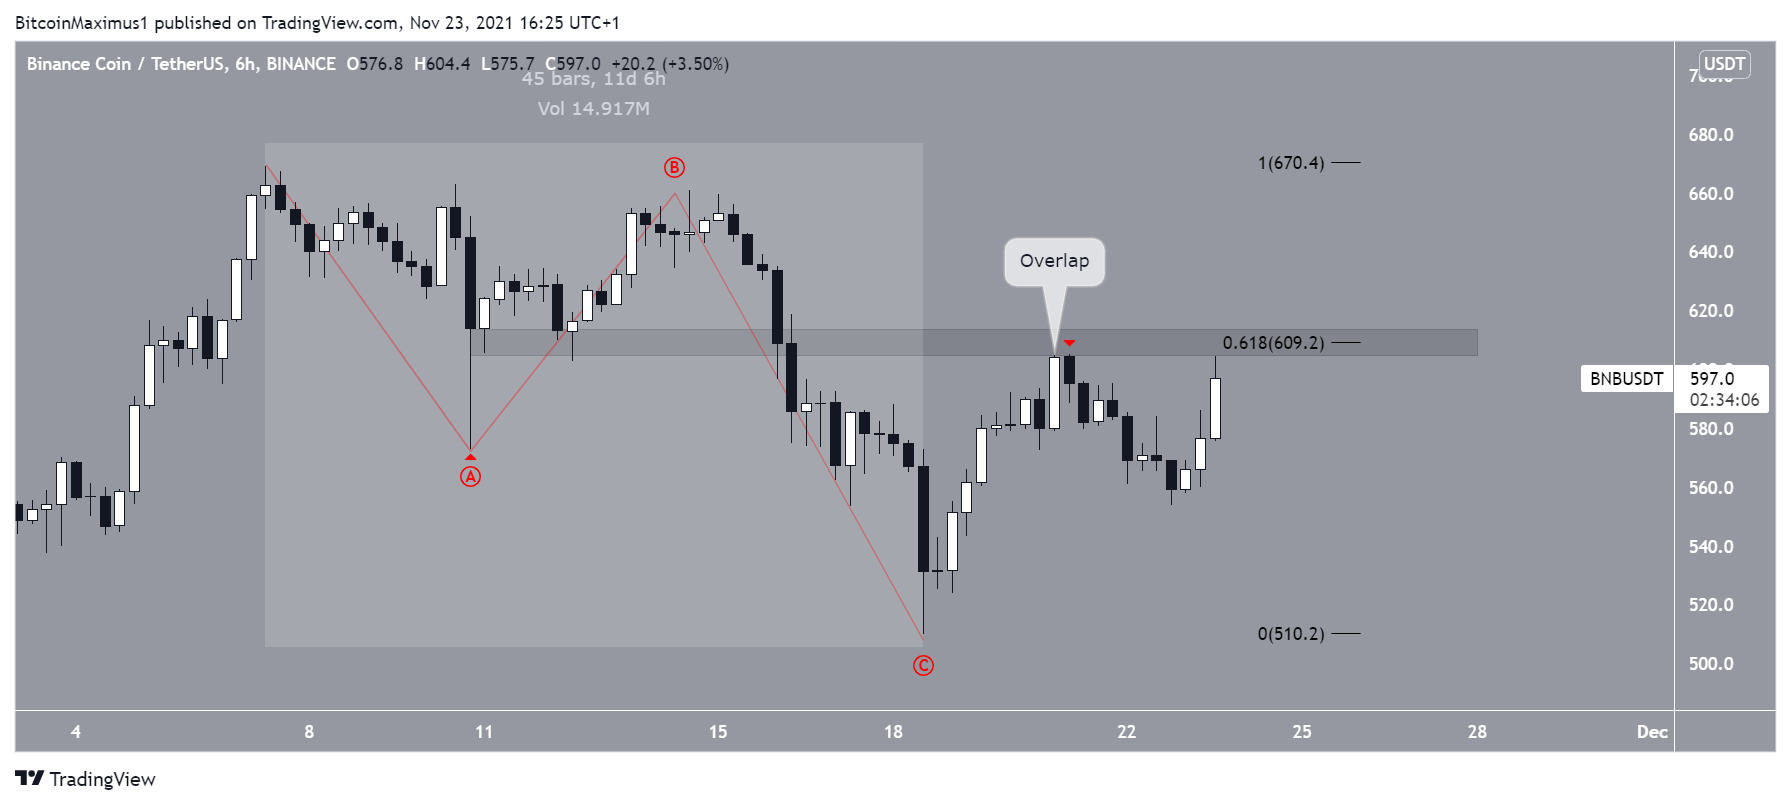
The short-term chart shows that BNB is facing resistance at $610. This is the 0.618 Fib retracement resistance level and a horizontal resistance area.
While the token was rejected from this area on Nov 21, it seems likely that it will eventually break out.
The reason for this is that the decrease that began on Nov 7 looks like a three wave corrective structure. This is especially visible because of the overlap (red icons) between the Nov 10 low and Nov 20 high.
In turn, it seems likely that the decrease was corrective while the trend is moving upwards.
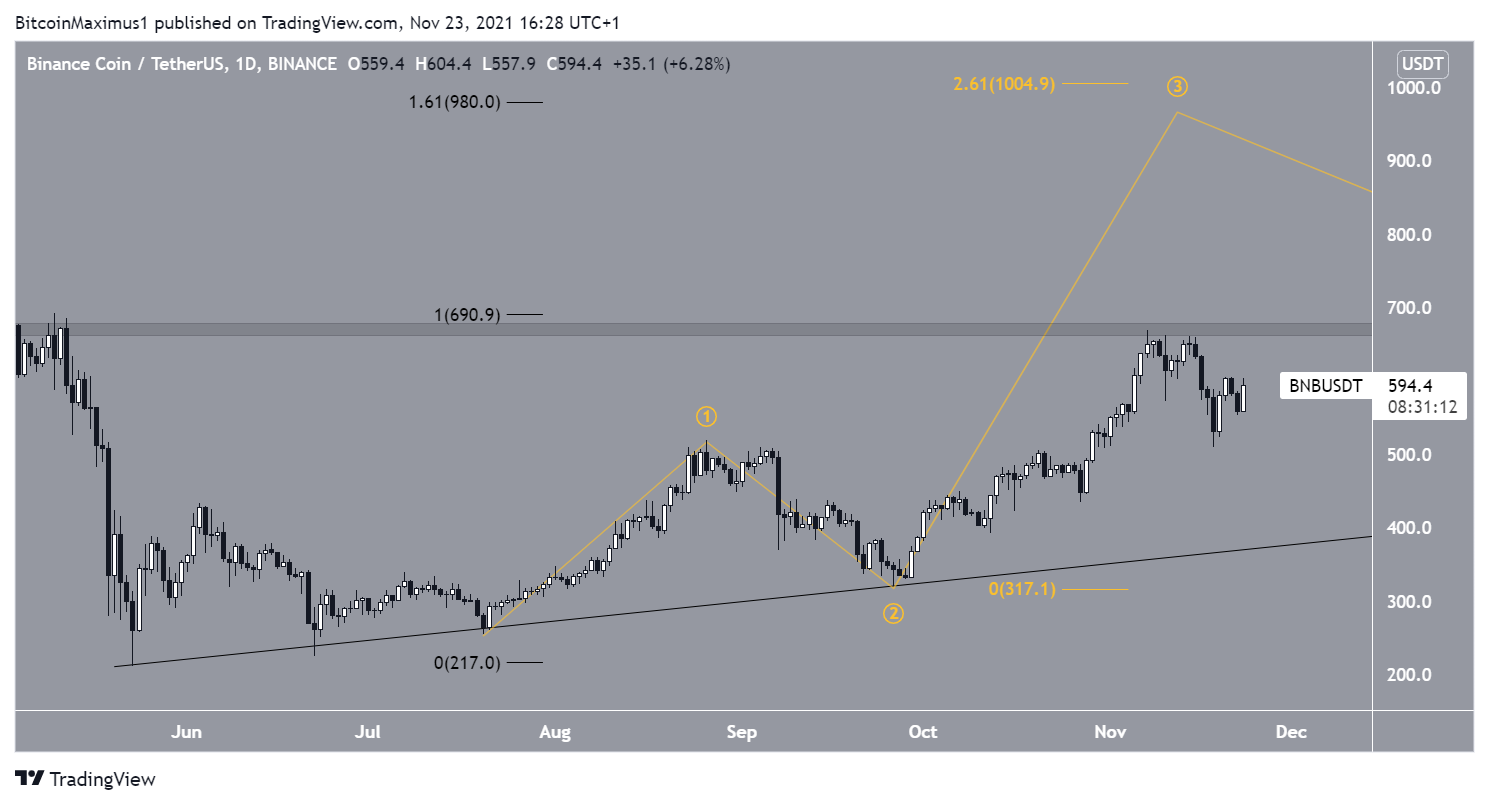
If the token does break out, the next resistance would be all the way at $980. This is the 1.61 external Fib retracement resistance level.
Furthermore, it seems that BNB is in wave three (yellow) of a five wave upward movement. Wave three is usually the sharpest out of the upward waves.
An increase that takes it to $1,000 would give waves A:C an exactly 1:2.61 ratio, which is the second most common after the 1:1.61 ratio.
Therefore, the $980-$1,000 area offers a confluence of Fib resistances for a local top.

For BeInCrypto’s latest Bitcoin (BTC) analysis, click here.
Disclaimer
All the information contained on our website is published in good faith and for general information purposes only. Any action the reader takes upon the information found on our website is strictly at their own risk.