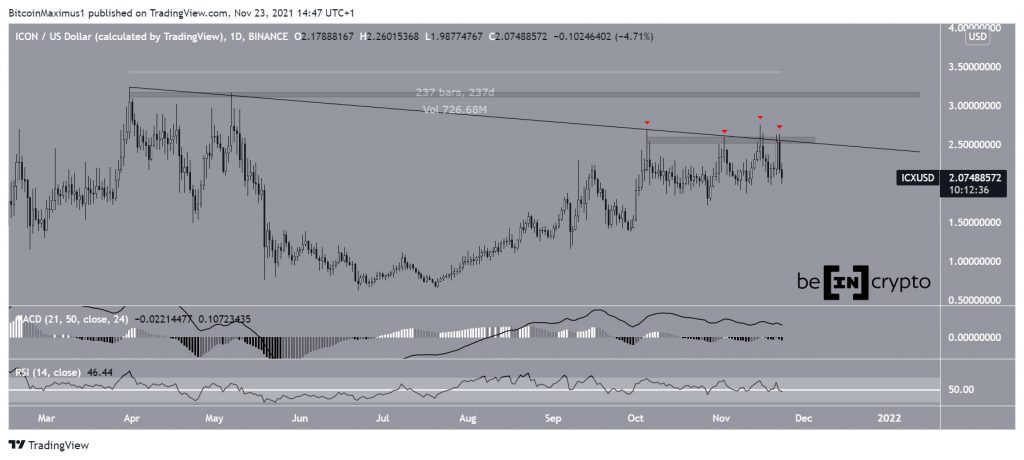
ICON (ICX) could soon make another attempt at breaking out from its short-term pattern, and potentially break out from its long-term one in the process.
ICX has been decreasing alongside a descending resistance line since March 31. Therefore, the line has been in place for 237 days.
Since Oct 5, the token has been rejected four times by the line, which also coincides with the $2.55 resistance area.
Resistances get weaker each time they are touched. Therefore, judging by this, an eventual breakout would be expected.
However, technical indicator provide a very neutral outlook.
The MACD, which is created by a short- and a long-term moving average (MA), is decreasing, even though it is still positive. This means that the short-term MA is decelerating in relation to the long-term one, but it is still faster than it.
The RSI, which is a momentum indicator, is right at the 50 line. This is a sign of a neutral trend, since movements above and below the 50 line are considered benchmarks for a bullish/bearish trend.
As a result, a look at lower time-frames is required in order to determine if ICX will break out.

Cryptocurrency trader @TheEuroSniper outlined a weekly ICX chart, which shows that the token is attempting to reach a new yearly high. The horizontal resistance area nearly coincides with the descending resistance line, further strengthening the level.


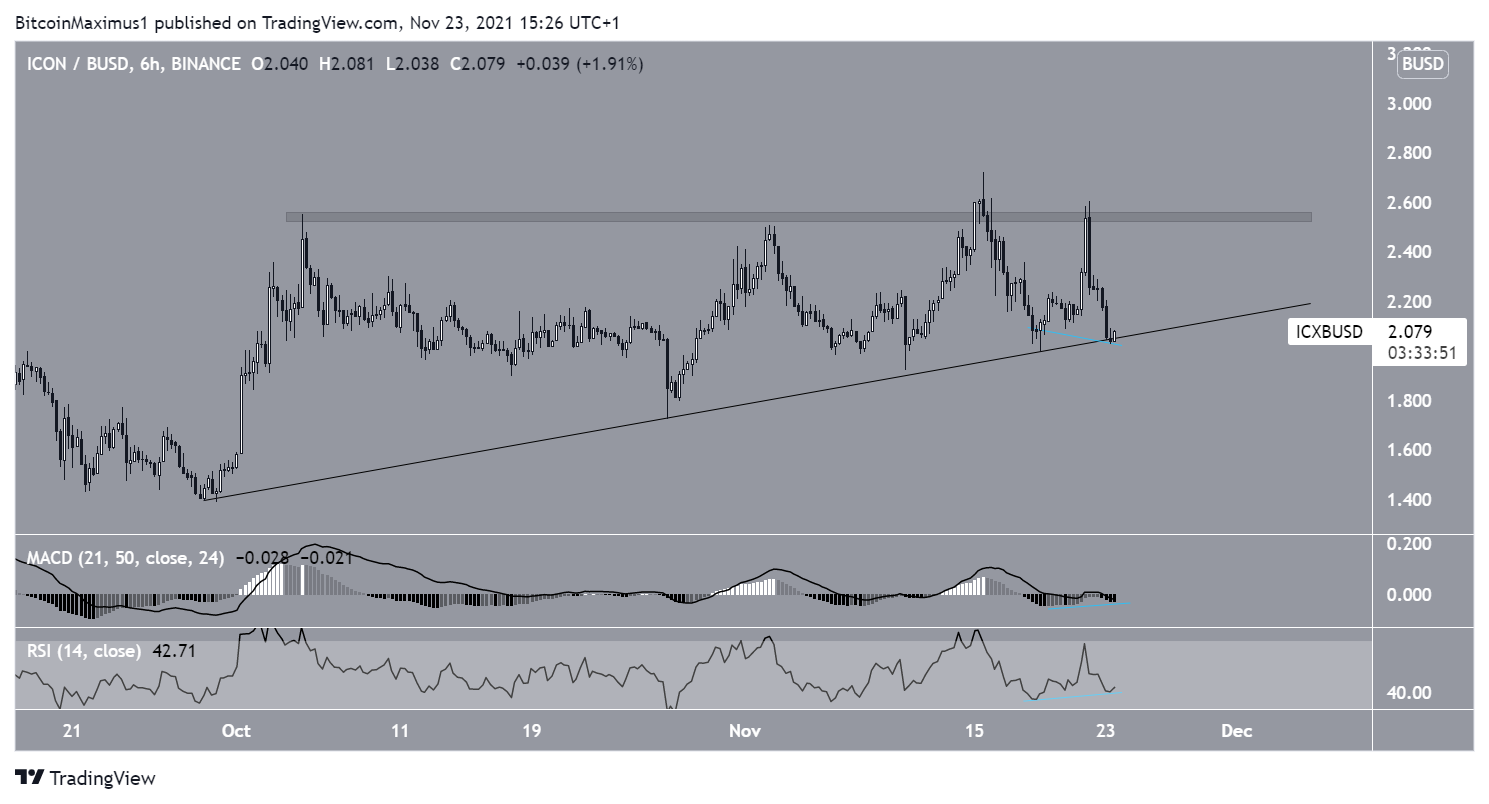
Short-term ICX breakout
The shorter-term six-hour chart is more bullish, indicating that a potential breakout is likely.
ICX has been trading inside an ascending triangle since Sept 30. The ascending triangle is considered a bullish pattern.
Furthermore, today’s bounce has been combined with bullish divergence in both the RSI and MACD. This means that the price decrease was not accompanied with a similar decrease in technical indicators. This occurrence often precedes bullish trend reversals.
Therefore, according to the six-hour chart, an upward movement towards the resistance area and then a breakout are likely.

Wave count
The most likely count suggests that ICX is in wave two of a five wave bullish impulse (yellow). Wave two is corrective, meaning that after it is complete, the upward movement is expected to resume.
The exact shape of wave two is not yet clear. It is possible that ICX is trading inside an ascending parallel channel. If so, it is currently close to the support line of this channel.
Therefore, after another touch of the line, the upward movement would be expected to resume. In turn, this would cause a breakout from the long-term descending resistance line.
For BeInCrypto’s latest Bitcoin (BTC) analysis, click here.
What do you think about this subject? Write to us and tell us!
Disclaimer
All the information contained on our website is published in good faith and for general information purposes only. Any action the reader takes upon the information found on our website is strictly at their own risk.