The Metaverse tokens are again in the spotlight as ‘bytedance’, the parent company of the famous entertainment app TikTok aims to set its footing in the metaverse ecosystem. The ALICE token price gained 25% in its intraday session and trying to break out from a crucial resistance level. Is there a buying opportunity?
Key technical points:
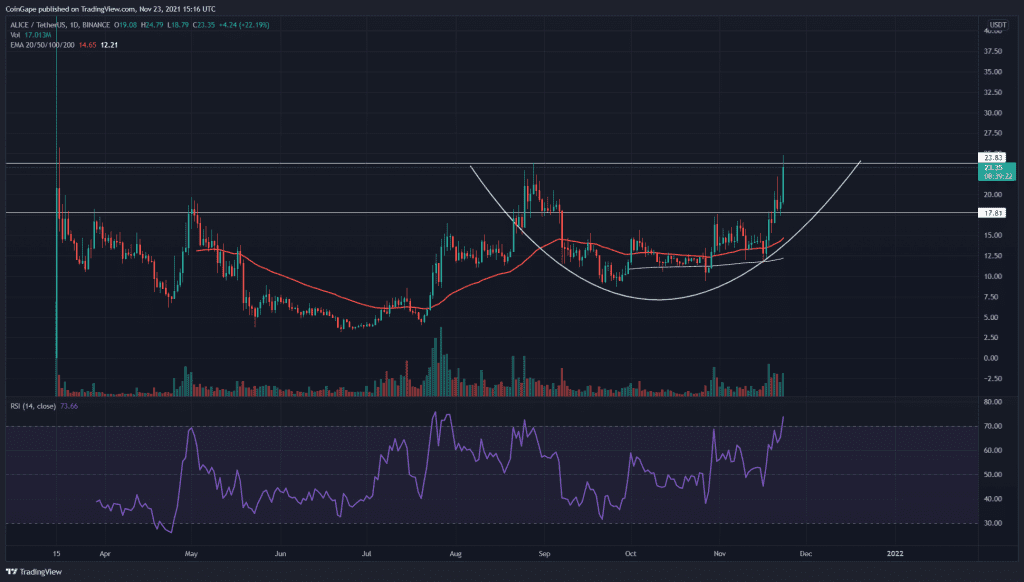
- The ALICE token shows a rounding bottom pattern in the daily time frame chart
- The d1aily RSI chart shows steady growth, supporting the token’s price action
- The intraday trading volume in the ALICE token is $893.4 Million, indicating a 111.4% gain

Source- ALICE/USD chart by Tradingview
Since the listing of the ALICE token on the Binance exchange, the token price has been trading below the $23.83 and $19.3 resistance levels. The token indicated several attempts to rally higher; however, all those were immediately rejected by those resistance levels.
However, the technical chart of ALICE/USD reveals a bullish rounding bottom pattern in the daily time frame chart. The neckline for this pattern is at $23.83, holding an excellent long entry opportunity for crypto traders.
The exponential moving average(EMAs) suggest the ALICE token price is moving above the 20, 50, 100, and 200 EMA line indicating a bullish trend. Moreover, The Relative Strength Index(74) displays an impressive growth in its chart, indicating the increasing growth of market buyers.
ALICE/USD Chart In The 4-hour Time Frame

Source- ALICE/USD chart by Tradingview
By the time of writing this article, the current price of the ALICE token is $23.3, standing at the doorstep of the bullish pattern’s neckline, i.e., $23.83. The crypto trader should wait until the price doesn’t give a decisive breakout from this resistance to obtaining a great entry opportunity.
According to the traditional pivot levels, which displays remarkable confluence with the know technical levels of this chart. The crypto traders can expect the nearest resistance for this token after this breakout at $28, followed by $33.
Note- If even the token price is rejected from the $23.83 resistance, there are several cases where unsteady of a rounding bottom pattern, the technical chart forms a Cup and Handle pattern to give a breakout from the neckline. Therefore, the crypto trader can still maintain a bullish sentiment until the price sustains above the crucial support of $17.7.
.
.