The month of November marked mixed feelings for the investors. Most cryptos attained their monthly milestones or ATH during this month, followed by a dynamic flip to the lower side.
Since the past two weeks, most cryptos have projected an overall bearish outlook. Accordingly, altcoins like Cardano, Polkadot and Ethereum Classic noted double-digit losses over the past two weeks.
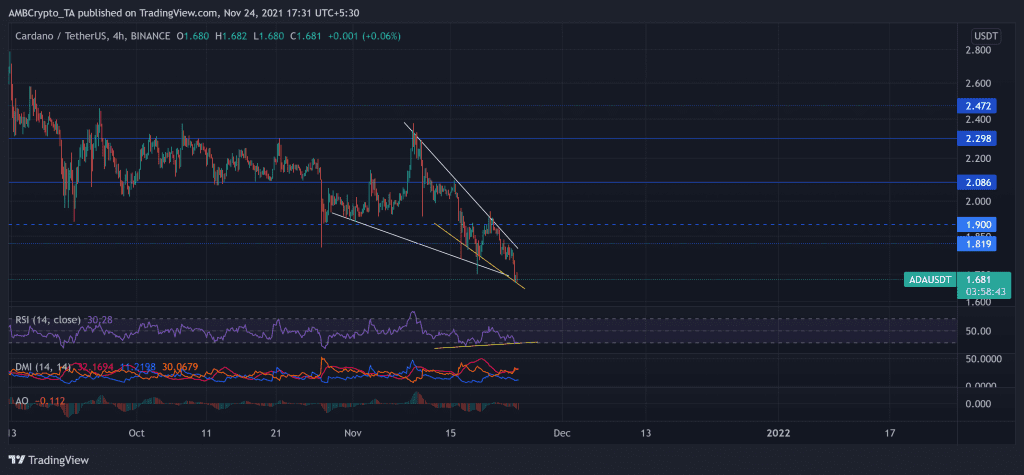
Cardano (ADA)
Unlike most cryptos, ADA witnessed a steady pullout since early September itself. The crypto registered a 41.34% decline from 2 September until it touched its 11-week low on 27 October. After which, the bulls triggered an uptrend to hit its one-month high on 9 November.
However, they struggled to find their ground and counter the sell-off as the price further dipped by 28.68% from 9 to 23 November. Consequently, the price poked its 15-week low on 23 November. While the bears breached the immediate resistance at the $1.8-mark, the bulls failed to find their strength.
At press time, ADA was trading at $1.681. The RSI undeniably preferred the sellers by swaying near the oversold territory. Besides, a bullish divergence (yellow trendline) along the RSI and price action pointed at a possible near-term revival. On the other hand, AO and DMI continue to display a bearish preference.
Polkadot (DOT)

TradingView, DOT/USDT
Since 30 September, DOT undertook a steady uptrend as the price moved along the parallel channel (white). Accordingly, it more than doubled its value over the next 35 days to poke its ATH at $55.09 on 4 November.
Since then, DOT bears took over as the price saw a nearly 31% retracement until it touched its five-week low on 18 November. Over the past two weeks, the bears exhibited sustained pressure as the price fell below its 4-hour 20-50-200 SMA.
+While bears ensured resistance at the $43-mark, they successfully pushed below the $39-mark (immediate resistance). Consequently, DOT traded at $39.24 at press time. The near-term technicals confirmed analysis by choosing the bearish side.
The RSI was southbound and stood at the 42-mark. Additionally, the DMI and AO also displayed an advantage for the bears. However, the ADX flashed a weak directional trend.
Ethereum Classic (ETC)

TradingView, ETC/USDT
After traversing sideways for over 25 days of October and reaching a downward milestone, ETC bulls triggered an upturn. The alt grew by 39.6% to poke its ten-week high on 9 November.
Since then, the bulls lost their edge as the price declined in a down channel (parallel, white). During this pullback, price action formed a descending triangle (green), visibly depicting a powerful bearish influence. After which, the price downturned by 28.67% from 9 November to touch its three-week low on 18 November.
The bulls will need increased momentum to breach the $51.5-mark (immediate resistance). At press time, ETC traded at $48.22. The RSI stood below the midline and skewed in favor of bears. Also, AO and DMI continue to display a bearish preference.