The Metaverse tokens are again in the limelight of our crypto market because of all the positive news roaming around the market about this trending technology. The DAR token had recently provided a great pullback opportunity when the price corrected to the 0.618 Fibonacci retracement level. The token price is already up by 40% from this recent support and is charging steady towards the overhead resistance of $4.54
Key technical points:
- The DAR token forming a Cup and Handle pattern in the daily time frame chart
- The DAR price is resonating in a rising wedge pattern in the hourly chart
- The intraday trading volume in the DAR token is $312 Million, indicating a 9.7% loss

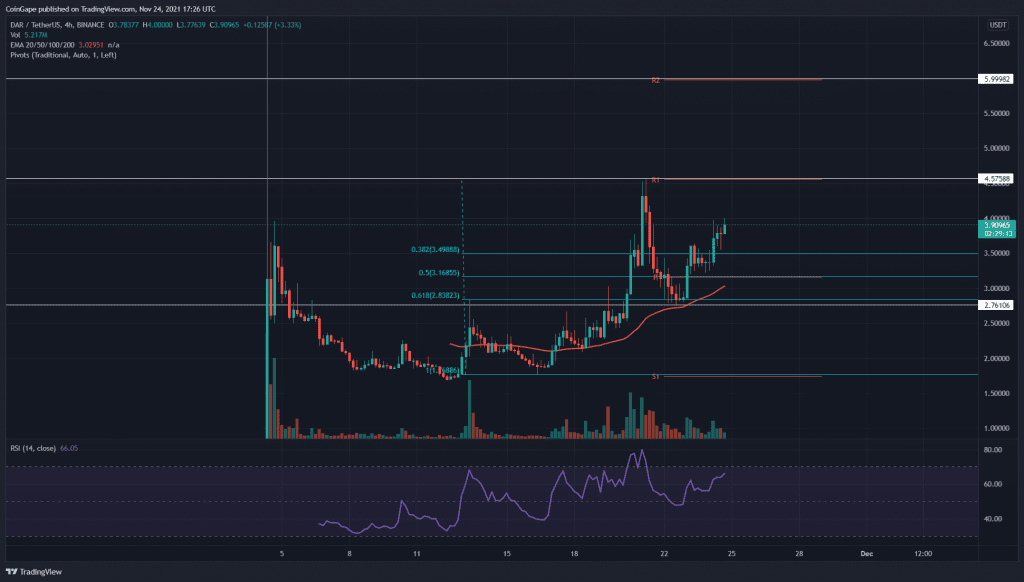
Source- DAR/USD chart by Tradingview
The DAR token price started rallying from the second half of November. The token made a new higher high of $4.57 before initiating a correction phase. The moderate pullback plunged the price to the 0.618 FIB level, which indicated sufficient demand present below this level.
The token price bounced back from this support level with a huge bullish engulfing candle, which immersed around five days of activity within its range. The token has started rallying again and is so far up by 40% from this level.
The DAR token displays a bullish alignment in the crucial EMAs(20and 50). Moreover, The Relative Strength Index(66) projects an impressive recovery in its chart, supporting the price action.
Important Weekly Announcements for DAR token
- ‘Bytedance,’ which is the parent company of TikTok, preparing growth with into the Metaverse technology
- “The $80 Million Metaverse Grant Program” was initiated by Mine of Dalarnia in collaboration with Chromia and My Neighbor Alice to expand and enrich its gaming universe.
DAR/USD Chart In The hourly-hour Time Frame

Source- DAR/USD chart by Tradingview
For this recovery phase, the DAR token price resonates in a rising wedge pattern, leading to the overhead resistance of $4.57. However, this rocket-like pattern has a tendency to give a strong downside movement when the price breaks down from its support trendline, and therefore, the long traders should keep a close eye on this pattern.
The MACD indicator confirms a bullish momentum in this lower time frame, as both the MACD and signal are moving above the neutral zone(0.00).
.
.
.
.
.
.
.
.
.
.
.
.
.
.
.
.