Ripple price forms a descending triangle technical chart pattern ahead of a potential downturn to $0.90. Even as the Ripple vs. SEC drags on, CEO Garlinghouse is confident that the case will reach a conclusion in 2022.
Ripple price continues to drag with no significant price movements in either direction. XRP has been trading between $0.88 and $1.40 since mid-August which has seen many refer to it as a ‘stablecoin.’
The uneventful Ripple price action has been largely attributed to the SEC vs. Ripple case which has dragged on for more than a year now, with no settlement expected in the near future.
XRP vs. SEC: Ripple Making Great Strides
The Ripple Labs CEO Brad Garlinghouse is confident that the fintech company is making great strides in its legal feud with the U.S. Securities and Exchange Commission (SEC), CNBC reports.
Garlinghouse said he expected the case, which revolved around XRP, the world’s seventh-largest crypto by market value according to Coingecko, has broader implications for the entire crypto market.
“We’re seeing pretty good progress despite a slow-moving judicial process. Clearly we’re seeing good questions asked by the judge. And I think the judge realizes this is not just about Ripple, this will have broader implications”, Said Garlinghouse.
Garlinghouse said he was hopeful the case will reach a conclusion next year.
Ripple Price Chart Pattern Spells Doom
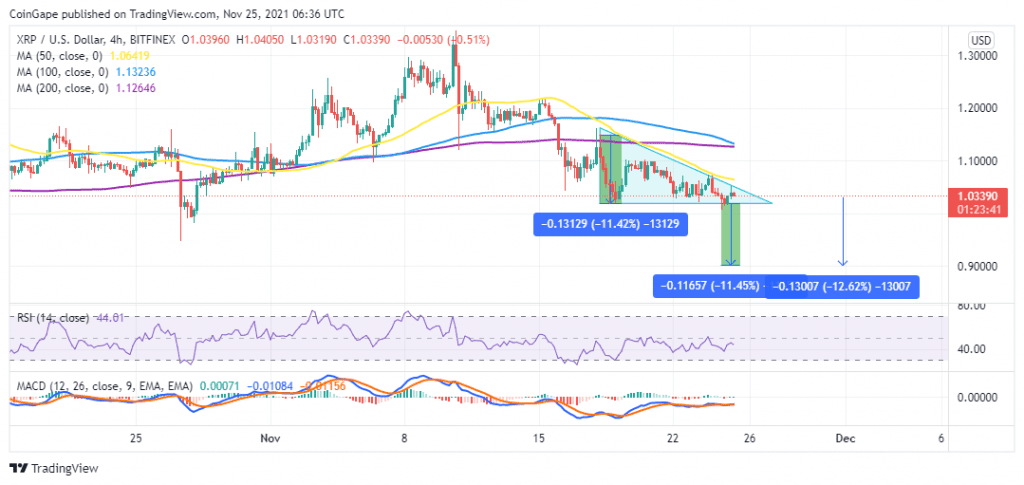
As predicted earlier, Ripple price dropped from $1.1851 to the current price around $1.0339 after forming a descending triangle on the two-hour chart.
The same scenario is likely to play out again as XRP price has formed a descending triangle chart pattern again but on the four-hour chart.
This means that a breakout below the triangle could see Ripple could drop 11.42% to tag the target of the prevailing chart pattern around $0.900 as shown on the four-hour chart. This represent a 13% drop from the current price.
The bearish outlook is accentuated by the down-sloping Relative Strength Index (RSI) indicator and its position around 42.32 suggest that the bears are currently stronger than the bulls.
XRP/USD Four-Hour Chart

On the upside, the Moving Average Convergence Divergence (MACD) indicator has just presented a buy signal in the same timeframe. This occurred when the 12 Exponential Moving Average (EMA) crossed below the 26 EMA in during the American trading sessions on Wednesday. This call to buy XRP revealed that overhead pressure was in the process of fading, a situation that would allow XRP to rise above water and sail into recovery.
Therefore, a closure above the 50 Simple Moving Average around $1.06 could confirm a bullish breakout as the November 17 range high at $1.16 becomes a possibility.