The correction phase in the SHIB token took its sweet time to stabilize our famous meme coin. The token price has been dropped to the 0.618 FIB level, which has the potential to provide strong support. Over the past week, the token price was also subjected to some positive news, which has captured the attention of several crypto investors.
Key technical points:
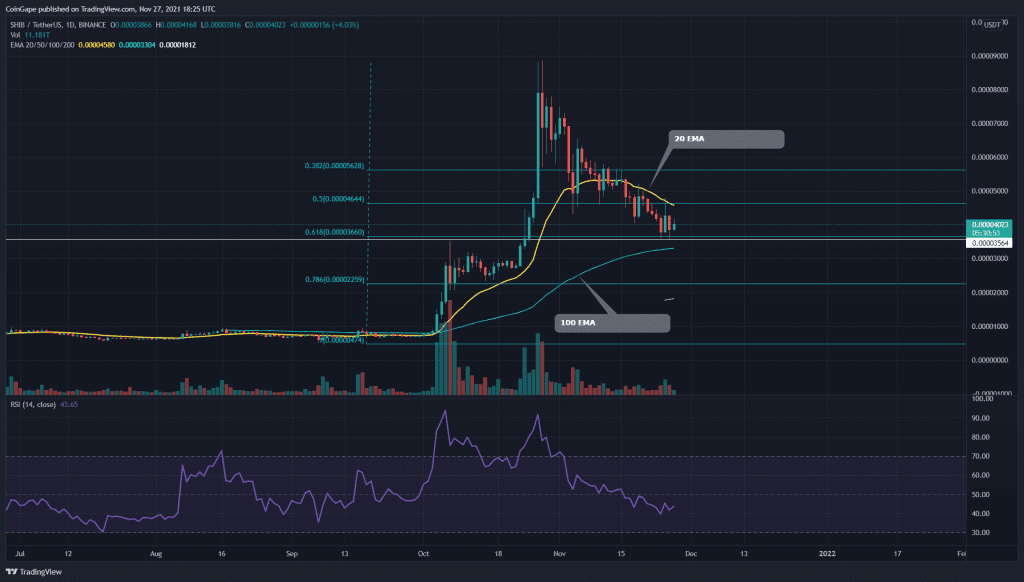
- The SHIB token price obtains dynamics resistance from the 20-day EMA
- The intraday trading volume in the SHIB token is $2.35 Billion, indicating a 41.5% gain
 Source- SHIB/USD chart by Tradingview
As mentioned in my previous article on SHIB/USD, the token price gave a bearish breakdown from the symmetrical triangle of the 4-hour time frame. This pattern pushed the token price back to the crucial support of $0.35.6, which also holds a great confluence with other technical levels.
These technical levels are
- A strong horizontal support level of $0.356
- The presence of the 0.618 FIB level
- The 100 EMA line soon be reaching the token price
The crucial EMA levels(20, 50, 100, and 100) still maintain an uptrend in this token. The Relative Strength Index(43) suggests a bearish trend within this token. However, the RSI line also projects a bullish divergence, indicating the bears are trying to take control over the token.
SHIB/USD Chart In The 4-hour Time Frame

Source- SHIB/USD chart by Tradingview
Above I have explained the importance of the bottom support level and it is also understandable that a breakout from this level, would create a significant impact on the SHIB token price.
The weekly announcement for Shiba Inu(SHIB)
- Newegg, the Electronic Retail giant, has officially announced on their Twitter page that they would be accepting the SHIB token as a payment in.’
- The SHIB token surpasses the 1 million wallet holders milestone.
Thus, in case the price bounces back from this support level. The crypto trade can notice the 20-day EMA line, and a descending trendline provides dynamic support to the price. Once the price breached this level, the long trader would get an excellent confirmation for the long side.