The majority of crypto coins that displayed remarkable rally in ‘Uptomber’ have now entered a correction phase in November. However, these minor pullbacks are ideally a one-step-back to another two-step forward rally, and therefore provide some excellent opportunities to buy your favorite crypto coin at a cheaper price. Check out the price analysis for these crypto coins.
BTC Coin Price Is Plunged To 0.382 Fibonacci Retracement Level

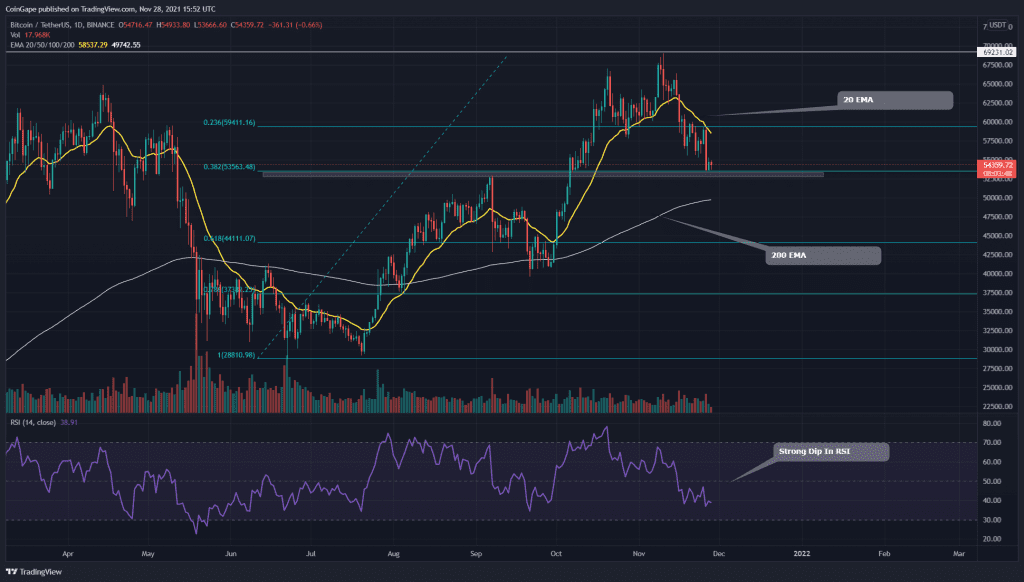
Source- BTC/USD chart by Tradingview
The technical chart of the BTC coin displays a clear uptrend of higher highs and lower highs. This rally made a New All-Time High of $69k on November 10th, and after experiencing significant selling pressure at this level, the coin entered a retracement phase.
The coin price is plunged to a crucial support zone of $53650-$53000, which is also the same level as the previous swing high level and the 0.382 FIB level. However, the price action has not yet signaled sufficient demand pressure from this level, and therefore, the safe traders can wait till the price breaches the 60K resistance level for better confirmation.
The Relative Strength Index(38) has shown a significant drop in its value for a minor pullback, providing even enough room for the BTC rally to grow.
DOT Coin Price Retest The 200-Day EMA

Source- DOT/USD chart by Tradingview
Initiated late in July, the DOT coin price provided an incredible rally for its investors. On November 4th, this coin made a New All-Time High of the $55.2 mark, after which the price began this correction phase.
However, the coin price has significantly dropped for such a pullback, displaying a V-top bearish reversal in its chart. The coin is currently hovering above crucial support of $33.5, which is in confluence with other major technical levels such as 0.5 Fibonacci retracement level and 200 EMA.
These support levels have enough potential to halt the ongoing fall; however, the crypto should wait for a proper price action signal before entering a new long position. Moreover, these traders can also wait for the price to breach the nearest resistance of the $38 mark for more confirmation.
BNB/USD Chart shows a Cup and handle pattern

Source- BNB/USD chart by Tradingview
The BNB coin initiated a significant rally in October which made a high of $675 resistance. Later, the coin faced strong rejection from this level which plunged the price back to the $517 mark. The bigger picture of this technical chart shows the BNB coin is forming a cup and handle pattern, holding an excellent opportunity for crypto traders.
The neckline for this bullish pattern is also the All-Time High resistance zone of $690-$670 mark, and a deceive breakout from this level could provide a proper entry signal for a long trade.
However, coin traders can observe a bearish divergence in the RSI chart, and therefore these trades should strictly follow their risk management if they are trading this price pattern.