The correction phase in the KSM token has displayed a significant fall in its technical chart. The token is currently dropped back to the $300 support, which is the previous swing low of this rally. However, the token has started showing some positive turns at this support level, suggesting the price could continue to rally again.
Key technical points:
- The KSM token displays a strong bullish divergence in the RSI chart
- The intraday trading volume in the KSM token is $141 Million, indicating a 33.7% gain
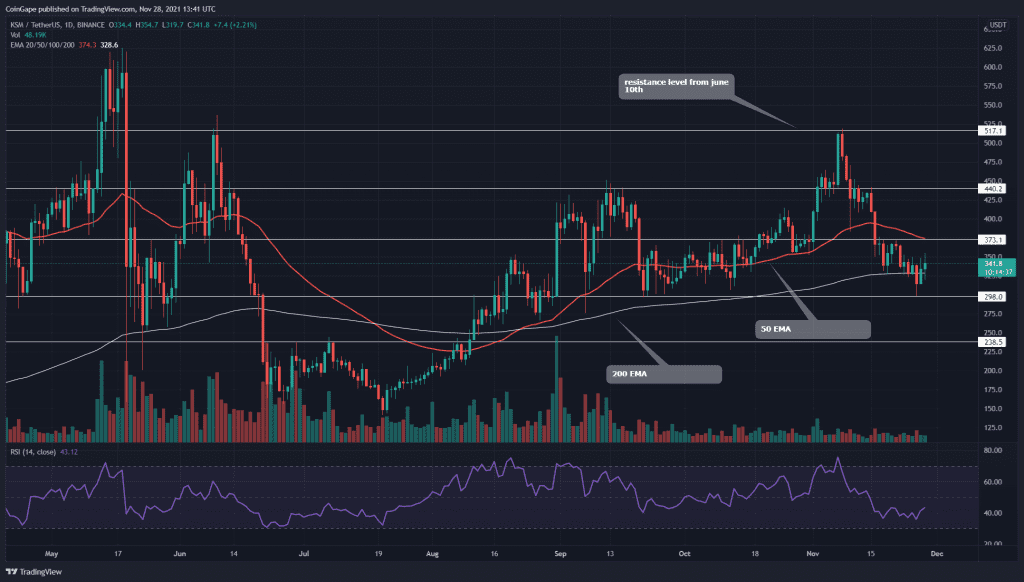
 Source- KSM/USD chart by Tradingview
The KSM token made a new higher high at the $517 mark before entering the correction phase. This crucial resistance goes way back, where it initiated the sudden fall of June ‘21. The token has lost 40% of its value in this pullback, displaying an evident V-Top pattern.
The token price is currently plunged to whole number support of $300, which projects decent demand pressure at this level. Moreover, the price has reclaimed the daily 200 EMA level, trying to maintain a bullish momentum in the token.
The Relative Strength Index(43) indicates a bearish sentiment within this token. However, the RSI line value has significantly dropped for this pullback, suggesting the token has enough room for growth.
KSM/USD Chart In The 4-hour Time Frame

Source- KSM/USD chart by Tradingview
The KSM token price bounced back from the crucial support of the $300 mark. This bullish reversal also reveals an inverted head and shoulder pattern, which has already given a decisive breakout from its neckline with strong support from the volume activity.
The token is currently in a retest phase, and if the price sustains above the neckline, the KSM price should rise to the $372 level. This overhead resistance could be a troublesome barrier or an excellent opportunity after a bullish breakout as it coincides with the 200 EMA in this lower time frame chart.
These traders can also observe a strong bullish divergence in the RSI chart, indicating the increasing bullish momentum in this token.