The Metaverse has become one of the favorite topics of the crypto ecosystem, and their token as an incredible investment opportunity for investors. However, the Majority of Metatokens were going through a correction phase of the October rally. If these tokens manage to sustain at these higher levels, the bulls may resume their rally for December.
MANA/USD Chart In The 4-hour Time Frame

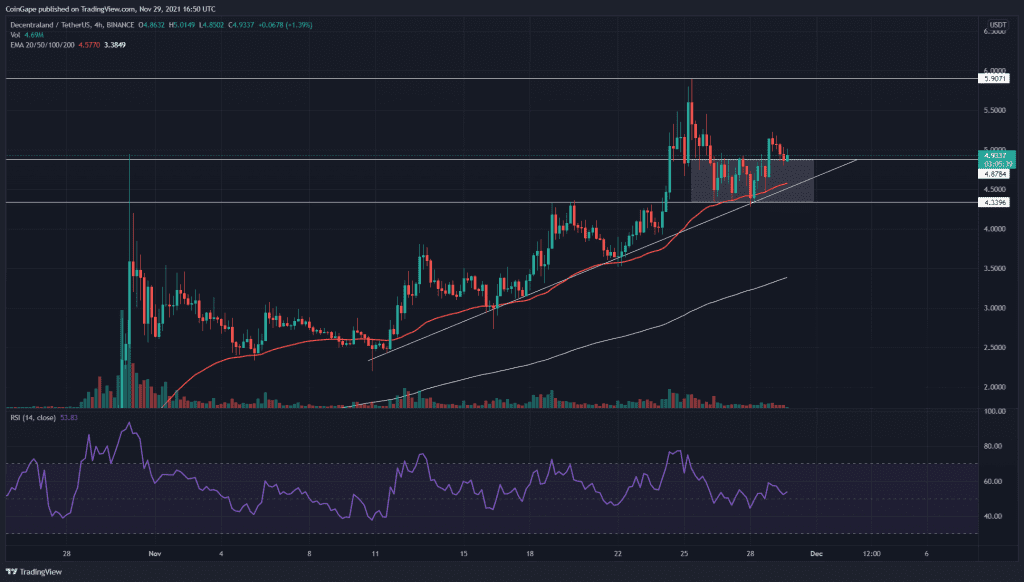
Source- MANA/USD chart by Tradingview
As mentioned in my previous article on MANA/USD, the token price breached the previous All-Time High resistance of the $5 mark. The token price rallied a bit and faced strong resistance from the $5.9 level, initiating another minor retracement in this token.
The token price was plunged to good support of the $4.33 mark, and after displaying triple bottom support from this level, the price again reclaimed the $5 resistance. The price is currently retesting this level to check for proper support, which will help the token rechallenge the $5.9 resistance.
Moreover, the technical chart indicated the MANA price is obtaining strong dynamic support from the ascending trendline and 50 EMA line, maintaining the uptrend in this token.
SAND/USD Chart In The 4-hour Time Frame

Source- SAND/USD chart by Tradingview
The SAND token price displayed a remarkable rally in its chart, marking a New All-Time High at the $8.5 mark. After experiencing strong rejection from this resistance, the token entered into a retracement phase that plunged the price to the $5.81 mark.
The token price obtained sufficient support from this level and showed a V-shaped recovery in this chart. The token could soon rechallenge the overhead resistance level of $8.5, trying to resume this uptrend. Moreover, the crypto traders can use the 50 EMA line dynamic support level that will maintain a strong rally in this token.
ENJ/USD Chart In The 4-hour Time Frame

Source- ENJ/USD chart by Tradingview
On November 23rd, the ENJ token indicated an excellent long opportunity to crypto traders when the price gave a decisive breakout from the $3.6 neckline of the Cup and handle pattern in the daily time frame chart. The token price rallied to the $4.8 level before returning to this level for a retest.
If the price sustains above the neckline, these traders can consider positioning their funds in this token for a long trade. Moreover, the 20 EMA line is providing dynamic support to the bull rally.