Ethereum (ETH) is trading 6% below its November 10 all-time high (ATH) around $$4,859 on Coinbase. The Ethereum is 4% lower on the day and still trades below the ascending parallel channel. At the time of writing, Ethereum price teeters at $4,521 and appears ready for a significant upswing as seen on the daily chart.
Ethereum Price Ready For A Santa Clause Rally
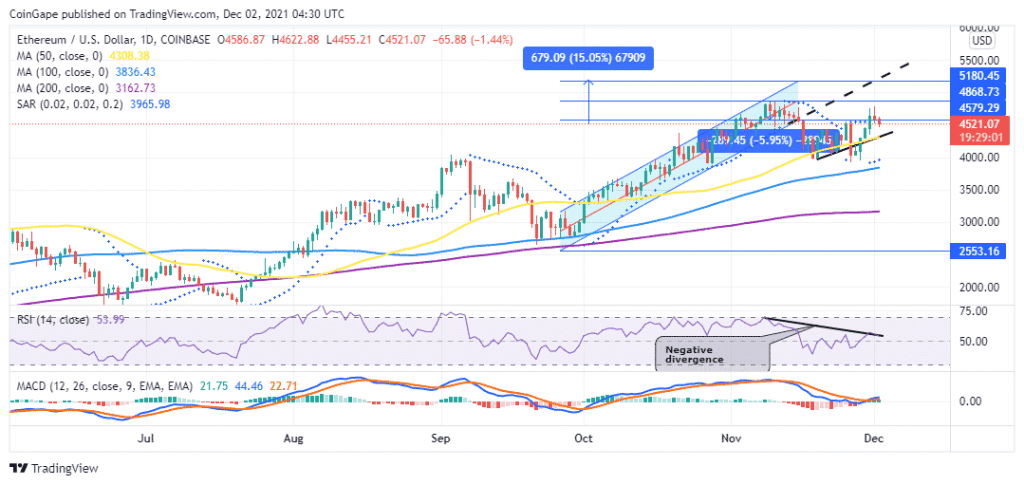
From a technical outlook, ETH/USD appears ready for a significant move upwards to new price discoveries. The only move that Ethereum bulls should focus on is overcoming the immediate resistance at $4,579 embraced by the lower boundary of the rising channel.
A breakout above the aforementioned level will place Ethereum price back into the confines of the rising channel. Sustaining the price action within the channel by recording a series of higher highs and higher lows will see ETH price eventually rise to tag the target of then prevailing chart pattern $5,180, a new record high. This would represent a 15% upward move from the current price.
However, ETH will meet significant resistance from the $4,868 level where the middle boundary of the rising channel coincides with the November 10 ATH.
Several technical indicators validate this positive outlook. To begin with, the upsloping moving averages and the upward movement of the Relative Strength Index (RSI) indicator shows that the ETH is comfortably in the hands of the bulls.
In addition, the Parabolic SAR and the Movign Average Convergence Divergence (MACD) indicator have sent a buy Ethereum signal on the daily chart. This happened on November 30 when the Parabolic SAR flipped below the price and the MACD line crossed above the signal line validating Ethereum’s bullish thesis.
ETH/USD Daily Chart

Moreover, on-chain metrics from IntoTheBlock’s In/Out of The Money Around Price (IOMAP) model shows that Ethereum faces relatively weak resistance upwards. From the Ethereum IOMAP chart it can be seen that the immediate support around $4,308 embraced by the 50-day Simple Moving Average (SMA) is within the $4,250 and $4,384 price range where aporoximately 3.53M ETH were previously bought by roughly 1.64M addresses. This support is robust enough to absorb any selling pressure thrreatenin to pull Ethereum price below this point.
Ethereum IOMAP Chart

The same IOMAP chart reveals that the path with little resistance for ETH is upwards adding credence to the bullish outlook.
Looking Over Then Fence
On the flipside, the RSI is displaying a negative divergence to the Ethereum price movement as seen on the daily chart. This implies that the bears have not given up on pulling the ETH price down, perhaps due to continued profit taking and uncertainties around the new Omicron Covid variant and the significantly hawkish tapering remarks from the Fed Chair Powell.
Therefore, sliding below the 50-day SMA support around $4,308 would trigger massive sell orders that could see ETH plunge towards the $4,000 level or the 100-day SMA at $3,162.