The crypto market saw 24-hour gains after a marginal recovery over the past day. While the overall outlook remained bearish, Cardano, Shiba Inu and VeChain marked their multi-month lows on 3 December.
Needless to say, the bearish preference of the near-term technical indicators after the bears breached multi-week supports may gain a long-drawn advantage.
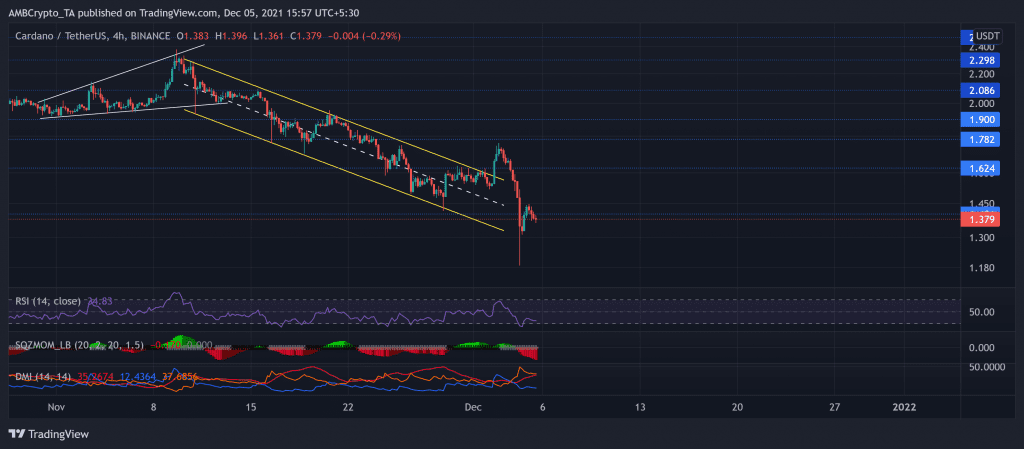
Cardano (ADA)
The altcoin has performed quite loosely after striking its ATH in early September. ADA dipped in a firm down-channel after hitting its one-month high on 9 November. Since then, the sell-off phase led to a price fall of over 49.9% as the price poked its 19-week low on 3 December.
ADA bulls retested the resistance at the $1.62-mark thrice until they eventually breached it after a down-channel breakout on 2 December.
However, the broader market sentiment added fuel to ADA’s long-term bearish fire. As a result, the price action broke down below the 16-week resistance at the $1.4-mark.
At press time, ADA traded 55.5% below its ATH at $1.379. The RSI wavered back into the bearish zone and showed no revival signs. Further, the Squeeze Momentum indicator flashed grey dots depicting a high volatility phase. Also, the DMI lines visibly confirmed the existence of a bearish market.
Shiba Inu (SHIB)

TradingView, SHIB/USD
The dog-themed coin has lost over 58% of its value since it struck its ATH on 28 October. SHIB persistently slackened in a down-channel after a descending triangle breakdown on its 4-hour chart. The bulls struggled to uphold the one-month support level at the $0.000035-mark.
After a down-channel breakout on 29 November, the bulls tried to mount a recovery but failed to uphold their momentum. Consequently, yielding to a broader sell-off, the price action poked its six-week low on 3 December.
Although the bulls tilted, they ensured the $0.00002914-mark support. Consequently, SHIB traded at $0.00003745 after noting a nearly 6.03% 24-hour gain.
Over the past day, the RSI preferred the sellers but saw a 12 point jump from the oversold region. Also, the DMI confirmed the bearish vigor after hinting at a weak directional trend.
VeChain (VET)

TradingView, VET/USDT
VET invalidated its long-term bullish trend after a steep dive that poked its four-month low on 3 December. The bulls lost their edge after the price touched its six-month high on 9 November. The alt witnessed a strong pullout as the price noted a 49.6% decline since then.
This descent marked a down-channel while VET bulls struggled to uphold the $0.10063-mark resistance.
At press time, VET traded at $0.09446 after noting a 5.6% 24 hour gain. The RSI saw a staggering plunge toward the 19.5-mark but failed to show revival toward the half-line. Also, the DMI undeniably preferred the bears with a high directional trend. Now, the buyers might find resistance at the $0.1006-mark with the continued bearish trend.