As the fear sentiment kicked in, the market saw an enormous sell-off over the past day. This decline led to an invalidation of long-term bullish outlooks of several cryptos, depicting a superior bearish influence for a while now.
Altcoins like Chainlink and Ethereum Classic showed revival signs from their historical supports, but their trend and technical indicators were still on the bearish side.
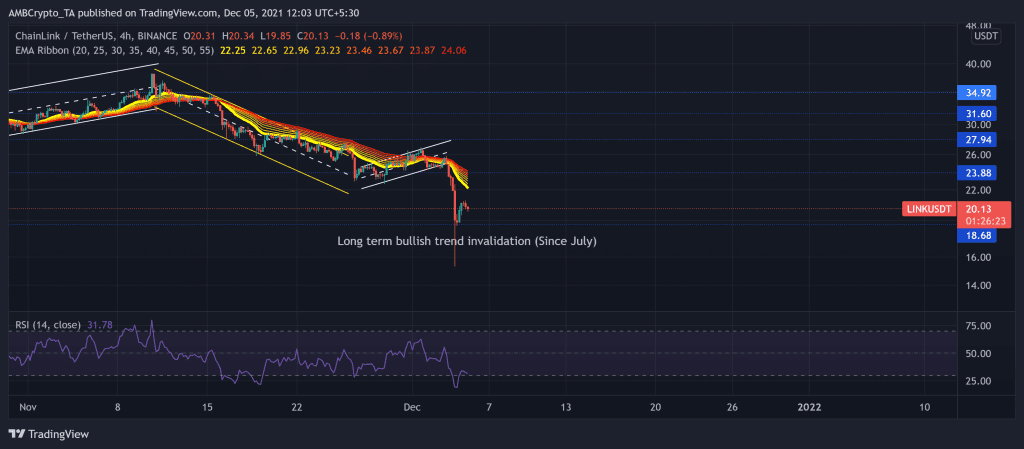
Chainlink (LINK)
Chainlink invalidated its long-term bullish trend after a steep plunge poking its 19-week low on 3 December. The crypto had been slackening after hitting its six-month high on 10 November. This descent marked a down-channel while LINK bulls struggled to uphold the two-month support level at the $23.8-mark.
Then, the bulls tried to mount a recovery by marking an 18% rally from 28 November to 1 December. But the price fell back from the upper channel and succumbed to the broader sell-off.
Although the bulls dwindled, they ensured the four-month support at the $18.6-mark. Consequently, LINK traded at $20.13 after noting a nearly 6.74% 24-hour gain.
The RSI touched its record low at the 19.07-mark on 4 December. Since then, it showed some revival but still lingered around the oversold region. Further, the EMA ribbons visibly display a bearish bias as the sellers alter the trend in their favor.
Ethereum Classic (ETC)

TradingView, ETC/USDT
After poking its ten-week high on 9 November, ETC correlated with the overall trend as a dynamic bearish flip occurred. The bulls lost their edge as the price declined between the down channel. Then, after a 10% up-channel breakout on 25 November, the bulls failed to sustain their edge as the price fell, marking a symmetrical triangle.
The bulls needed to sustain the 19-week support at the $44.7-mark. But they failed to uphold that level causing a further breakdown toward its seven-month low at $28.12.
However, at press time, ETC traded at $40.4 after noting a 13.3% 24 hour gain. The RSI saw a staggering plunge toward the 12-mark but showed some revival signs over the past day. Also, the DMI undeniably preferred the bears with a high directional trend. On the flip side, the AO projected a near-term bullish setback.
Avalanche (AVAX)

TradingView, AVAX/USDT
Despite a substantial breakdown on 3 December, AVAX did not bid adieu to its long-term bullish trend.
Since 12 October, AVAX visibly witnessed monstrous gains by steadily up swinging. The digital currency noted an over 180% 39-day ROI to touch its ATH on 21 November. Since then, the price fell back into the trend until an up-channel breakdown on 2 December. The alt saw a 17.6% loss over the past week and resonated with the broader market trend.
This decline swiftly pushed the price below the $87.7 mark, but it quickly recovered and found support at the golden 61.8% Fibonacci Level. The RSI chose the bears but showed slight revival signs. Considering the vast difference between the DMI lines, the market visibly signaled a bearish trend for a while.