While the top 10 Cryptos were in red in the past 24 hours, Ethereum and Uniswap technicals flashed mixed signs. The overall momentum favored the sellers, while the bulls continued their steady near-term revival.
On the flip side, MATIC projected bullish near-term technicals as it endeavored to cross its ATH.
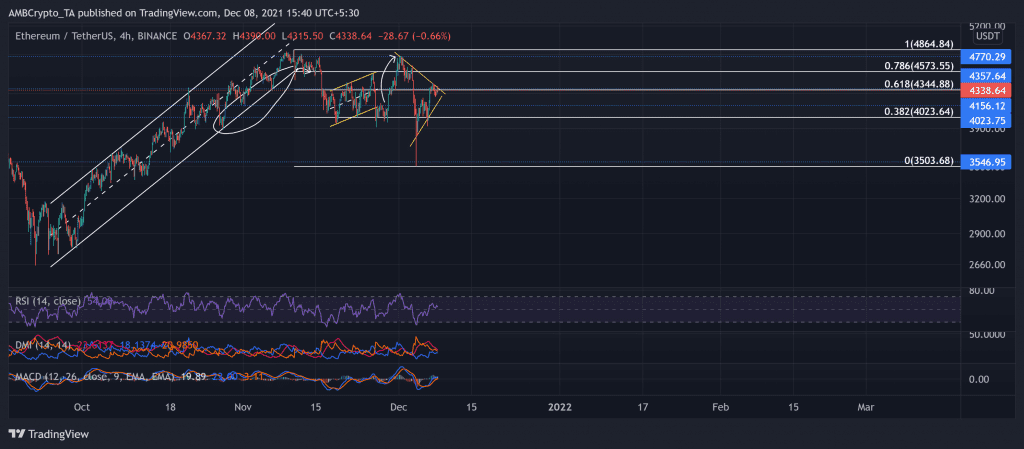
Ethereum (ETH)
The bears retested the lower channel (white) four times until ETH saw an up-channel breakdown. The downfall, however, was supported by its seven-week support at the $4,023-mark. After moving in an up-channel (yellow) for a brief period, the price action obliged the $4,770-resistance and saw a sharp pullback.
Although the recent bearish movement marked as a blip in its long-term bullish trend, ETH managed to recover by over 20% over the past five days after poking its seven-week low on 3 December. With this upturn, it climbed above the 38.2% Fibonacci resistance. Over the last few days, ETH marked a symmetrical triangle on its 4-hour chart.
At press time, the alt traded at $4,338.6. The RSI was in an uptrend but seemed to head toward the midline. The MACD histogram was above the zero-line and confirmed a bullish momentum. However, the DMI indicated a slight bearish preference in the near term, with a weak directional trend.
MATIC

Source: TradingView, MATIC/USDT
After a minor retracement, MATIC witnessed a monstrous 46.25% ROI from 28 November (low) to 3 December. This incline propped MATIC to touch its six-month high on 3 December. Accordingly, the price breached its six-month-long resistance at the $2.22-mark.
Then, the altcoin lost over one-third of its value and touched the $1.5-mark on 4 December. Over the past four days, MATIC formed a double-bottom post an up-channel downfall on its 4-hour chart.
Consequently, at press time, MATIC traded at $2.44 after noting a staggering 42% gain from its low on 6 December. Although it traded just 7.8% below its ATH, the RSI could not reach the overbought level. This reading indicated a strong bullish force. Further, DMI and MACD reaffirmed the previous analysis by choosing the buyers.
Uniswap (UNI)

Source: TradingView, UNI/USDT
UNI invalidated its long-term bullish trend (since July) after an abrupt fall that poked its 28-week low on 3 December. The bulls lost their edge after the price hit its two-month high on 10 November.
Although the bulls triggered a rally, they found strong resistance at the golden 61.8% Fibonacci Level. Since then, after a broader sell-off situation, bulls failed to maintain the 19-week resistance at the $18.3-mark.
However, it saw a revival from its six-month-long support at the $13.8-mark. Consequently, the alt grew by over 33% since the 3 December low.
At press time, the alt traded at $17.75. The RSI swayed near the midline after flashing neutral signs. Although the DMI depicted a slight bearish preference, it hinted at increasing bullish momentum. However, the 38.2% Fibonacci stood as a strong hurdle for the bulls.