While most cryptos struggled to counter the steep breakdown that occurred on 3 December, Terra’s LUNA saw soaring gains during the recovery phase until it touched its ATH on 5 December.
Solana, on the other hand, grappled to turn the trend into its favor while Binance Coin flashed mixed signs.
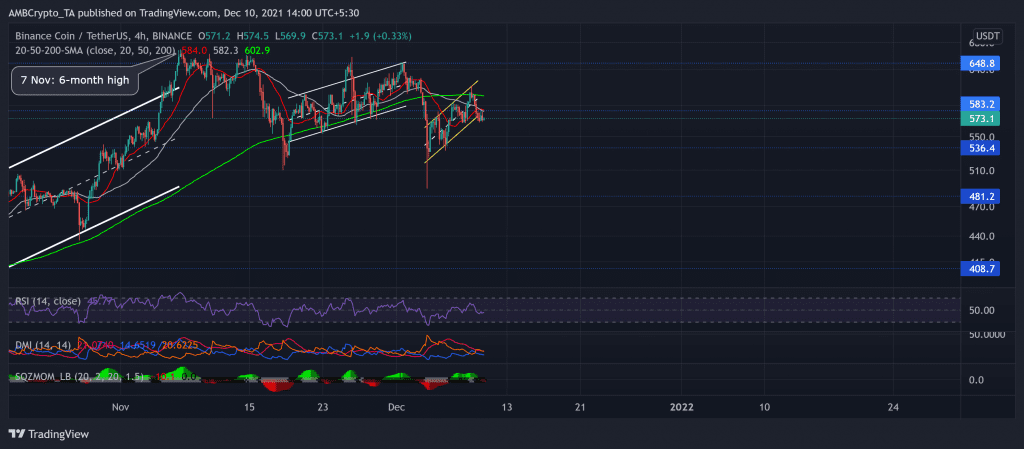
Binance Coin (BNB)
BNB recurringly formed an ascending channel (yellow) after an up-channel breakdown on 4 December. The alt continued its long-term bullish trend despite a massive sell-off. After poking its six-month high on 7 November, the price action saw a pullback as the bears ensured the long-term resistance at the $648.8-mark.
The bears retested the $583.2 resistance thrice before finally breaching it to hit BNB’s five-week low on 4 December. Since then, the bulls retaliated, but an up-channel breakout on 9 December confirmed the increased bearish vigor.
The RSI saw a 16 point plunge in 24 hours below the midline. Thus, BNB traded below its 4-hour 20-50-200 SMA at $573.1. While the DMI reaffirmed the bearish bias, the ADX (red) displayed a weak trend for the alt. Also, the Squeeze Momentum Indicator flashed black dots, hinting at a low volatility phase.
Solana (SOL)

Source: TradingView, SOL/USD
Like BNB, SOL bears increased the selling pressure over the last month as the alt touched its lifetime milestone on 6 November. The alt plummeted by marking a down-channel (yellow). Then, after losing nearly one-third of its value, the price poked its six-week low on 3 December.
The bulls failed to uphold the $183 six-week support as the bears retested that level multiple times over the past week. As a result, SOL saw a 24.1% weekly downfall and an up-channel breakdown.
At press time, SOL traded at $176.6. The RSI plunged toward the oversold region after preferring the bears. Also, the DMI resonated with the bearish RSI readings. Considering the gap between the DMI lines, the bulls will need to propel higher volumes to alter the trend in their favor.
Terra (LUNA)

Source: TradingView, LUNA/USDT
LUNA entered into price discovery after touching its five-week low on 24 November. The alt saw an exceptional rally of over 104% from 26 November to 5 December. LUNA skyrocketed in an up-channel to touch its ATH on 5 December. Meanwhile, it became the tenth-largest crypto in terms of market cap.
In light of a market-wide breakdown, the alt saw a nearly 20% correction on 3 December but found strong support at the golden 61.8% Fibonacci level.
Since then, the digital currency formed a classic bullish pennant pattern on its 4-hour chart.
At press time, LUNA traded at $69.28 after noting a 7.9% 24-hour. The RSI seemed to find support at the midline. Also, the DMI affirmed a slight bullish preference. The AO projected the 24-hour decline by flashing red signs. Nevertheless, LUNA’s directional trend stood weak as per ADX (red).