The Bitcoin NUPL indicator shows the market is currently testing a key support level that may be a junction between bullish and bearish trends.
Bitcoin NUPL Shows Market Currently Stands At Key Support Level
As per the latest weekly report from Glassnode, the NUPL shows that the market has entered a key zone that can decide whether the following trend will be bullish or bearish.
The Net Unrealized Profit/Loss (NUPL) is an on-chain indicator that measures the difference between the unrealized profit and loss to check whether the market as a whole is currently in a state of profit or loss.
The metric measures this by looking at what price each coin on the chain was bought at, and comparing it with the current price.
When the value of the indicator is below zero, it means the overall Bitcoin network is in a state of profit at the moment.
On the other hand, when NUPL assumes values above zero, then the market is, on an average, having unrealized gains.
Related Reading | Weekend Volatility Awakens Bitcoin Buyers, Active Addresses
Now, here is a chart that shows how the value of this Bitcoin indicator has changed over the past year:
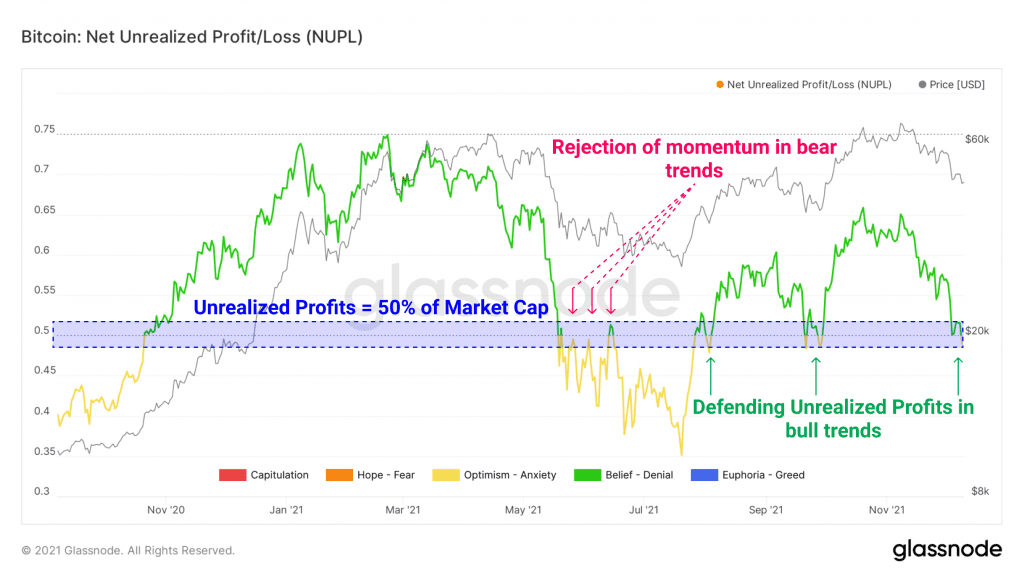
Looks like the overall market is currently in a state of profit | Source: The Glassnode Week Onchain (Week 50)
As you can see in the above graph, there is a highlighted zone around the NUPL value of 0.5. At this value, 50% of the Bitcoin market cap is in the form of unrealized gains.
Related Reading | Goldman Sachs CEO Sidesteps Bitcoin Inquiries, Says Blockchain Is More Important
The report describes this zone as a historical battleground between the bulls and the bears. During periods of bearish trend, this zone usually provides resistance, while in times of bullish sentiment, the zone would act as support.
Now as the chart shows, the indicator seems to be touching this zone again. This type of retest has already happened a few times in the past few months, and the bulls stood strong during those.
Back during the May crash, however, the support didn’t last and the indicator shot below the zone. Afterwards each touch of the zone sent the price back down.
It’s possible that the market might hold support here as well just like the last few retests. But it’s not set in stone; any transition down here could be bad for the coin’s price, just like how it was in May.
BTC’s Price
At the time of writing, Bitcoin’s price floats around $46.9k, down 8% in the last seven days. The below chart shows the trend in the price of BTC over the last five days.

BTC's price once again plunges down | Source: BTCUSD on TradingView
Featured image from Unsplash.com, charts from TradingView.com, Glassnode.com