The king coin for the most part of December has been oscillating around the $50K mark, firmly holding the ground. At the time of writing though, Bitcoin’s over 5% dip took the top asset under the $45,000 mark. Ergo, the larger narrative seemed to tip more towards the bearish side, giving way to the evergreen argument – “Are we in a bear market?”
Is this really a bear market?
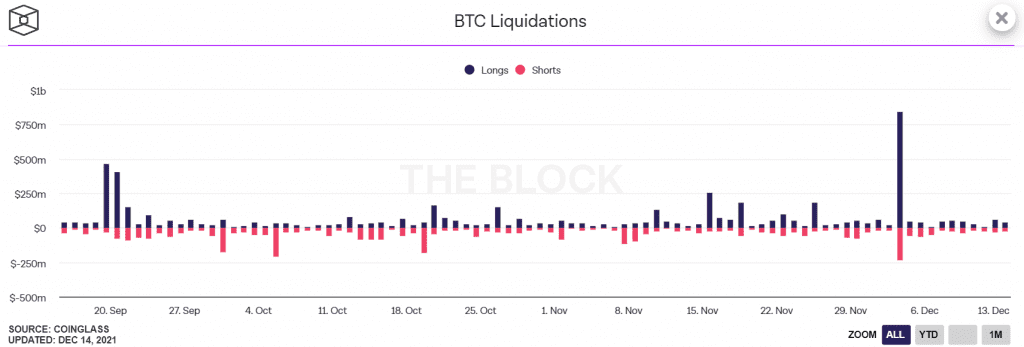
The global crypto market cap after BTC’s fall saw a 6.04% decrease over the last day. It, therefore, stood at $2.12 trillion at the time of writing. There was a surge in Bitcoin liquidations on 3 December with $235 million worth of BTC short futures liquidated, and $846 million long futures liquidated. The same caused BTC’s spot price to plunge from $51,000 to $42,000. Furthermore, Open interest of BTC futures also dropped from $23 billion to $17 billion on 4 December.
The most recent price fall near the $45K level, however, didn’t trigger a similar liquidation spree. Notably, the spot market seemed more affected as lower trade volumes and higher fear in the market kept investors skeptical of any moves further.
That being said, the BTC Bull Market Weekly Support Bands can act as good indicators of the market condition presenting the macro trend by looking at the 20-week exponential moving average (20W EMA) and the 21-week simple moving average (21W SMA).
In prior bull market cycles, BTC has reverted down to the 20W EMA and 21W SMA before bouncing and resuming a bull market uptrend. However, a close below both moving averages is indicative of a bear market. BTC’s current price is around $46,950 while the 20W EMA sits at $51,984 and the 21W SMA sits at $52,154.

Source: Kraken Intelligence
Earlier this year BTC’s move below both bands suggested BTC is in a bear market as seen, at the time of writing. There is, however, a possibility that price picks up and BTC climbs back above said bands to enter back into a bullish uptrend. A move above the 20W EMA would imply a +10.7% rally from the current price, while a climb to 21W SMA equates to a +11.1% increase from current levels.
What has changed?
While there have been comparisons of the current BTC trajectory to the May price dip, from an on-chain perspective. The key difference between now and May is that now strong hands are buying from weak hands while in May strong hands became weak hands.

Further, looking at BTC’s +1 year HODL wave approximately 54.6% of all coins in circulation haven’t moved in +1 year. Even though currently the indicator is down 8.8% points from a local top of 63.4% set in September 2020. However, there are signs of the indicator rallying which can be suggestive of BTC’s supercycle if the uptrend continued.

Source: Kraken Intelligence
That being said, BTC’s 14M RSI after the fall is now into the ‘neutral’ territory. The same hit intra month high in April 2013, November 2013, and December 2017, setting the price as a market cycle top. This time, however, the same has not been observed.
Well, for now, a fall to lower levels can be expected in the near future. With volatility taking over the game for BTC, it’ll be best to stay cautious and not make any new moves.