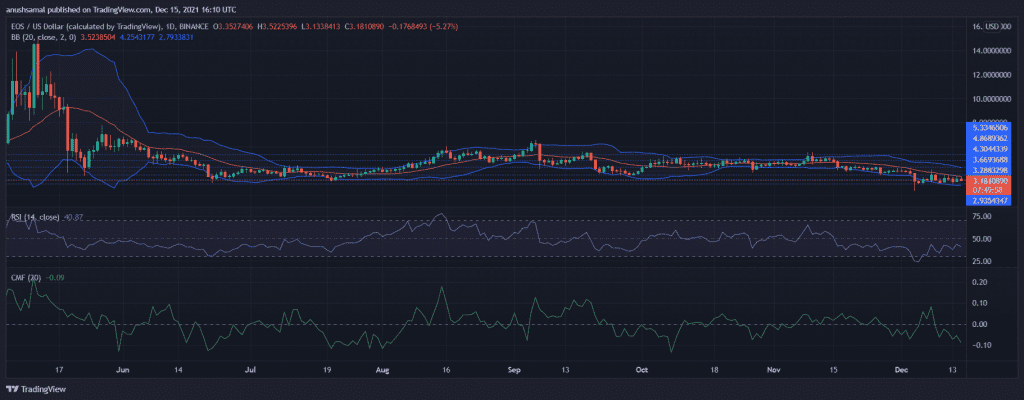
EOS was trading at $3.18 and had declined on its chart by 3.3% over the last 24 hours. The token had been displaying a bearish price trajectory and at the current price level, EOS was almost 151% below its all time high. The consolidation on its charts forced buyers to exit the market, the token recently fell below its long standing support level of $3.28.
EOS/USD One-Day Chart
The Relative Strength Index displayed negative buying pressure as the indicator remained below the half-line ever since the end of November. If buying pressure revives, then EOS might find itself trading near its immediate resistance of $3.28 and then finally at $3.66.
In respect to volatility, the indicator displayed narrowed bands, which meant that volatility would remain low and EOS could continue to trade in a consolidated manner. Further consolidation could also push the coin to trade lower than its current price level at its local support of $2.93.
Chaikin Money Flow had displayed considerable signs of recovery in the last few days, but as support from broader market withdrew itself, capital inflows also had started to lessen.
VET/USD One-Day Chart

VeChain declined over 13% in the last one week and at press time the coin was trading for $0.0754. Over the last 24 hours VET declined 3.7%. As seen on the daily chart, VET was trading within a descending channel. VET seemingly would encounter a robust resistance at the 61.8% Fibonacci level. Immediate resistance for the coin stood at $0.0772, breaking above which VET could trade around the $0.1007 mark.
The Relative Strength Index remained below the half line for the past few weeks and buying action remained bearish. On the Directional Movement Index the -DI stood over the +DI line which indicated that the trend for the coin was bearish at the time of writing.
With continued decreased buying strength, VET could soon fall to the $0.0576 support line. Although VET’s trading trajectory was bearish, the coin was still 100% above its all time low price.
LINK/USD One-Day Chart

Chainlink was trading for $17.41 and it noted a 2.7% depreciation over the last 24 hours. The coin was trading within its descending channel. The immediate resistance for the coin stood at $21.31 and the other price ceilings stood at $24.93. The price of LINK was seen below the 20-SMA which meant that price action was dominated by sellers in the market.
The local support level of the coin was at $17.38 and $13.77. If buyers come back to the market, Chainlink might witness a resistance at the 38.2% Fibonacci level.
The Relative Strength Index was in the bearish zone. With a fall in selling pressure, LINK might retest the $21.31 and $24.93 level again.