BeInCrypto takes a look at Bitcoin (BTC) on-chain indicators that relate to lifespan. More specifically, Liveliness, Average spent output lifespan (ASOL) and Coin days destroyed (CDD) will be analyzed.
Liveliness
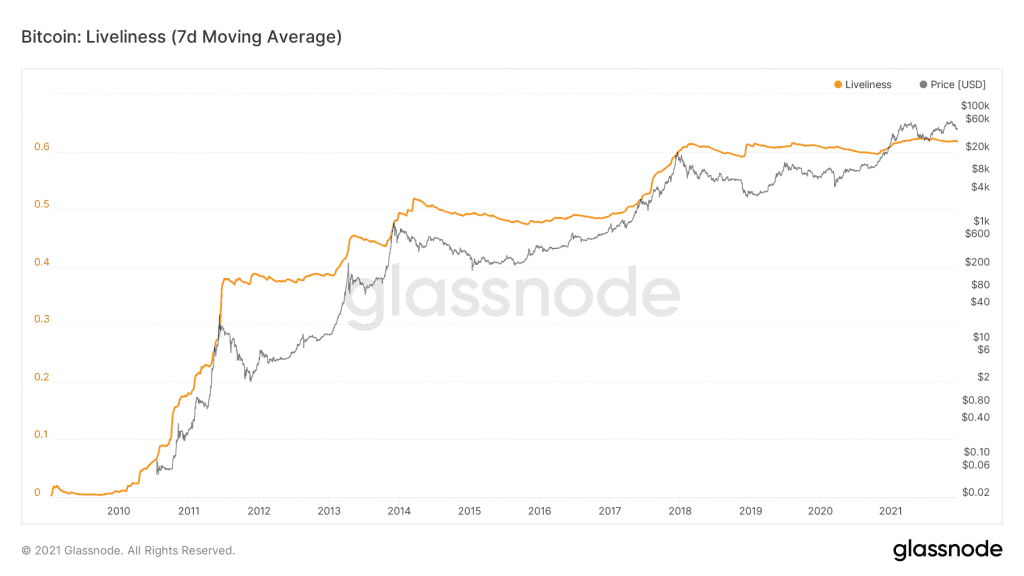
Liveliness is an indicator that shows the age of coins being spent. It gives values between 0 and 1.
A high reading means that older coins are being spent, while a low one means that young coins are being spent. Over the past two years, the indicator has given readings between 0.59 and 0.63, showing no considerable movement.
Therefore, instead of focusing on absolute values, it is more important to note whether the slope of the indicator is moving upwards or downwards.

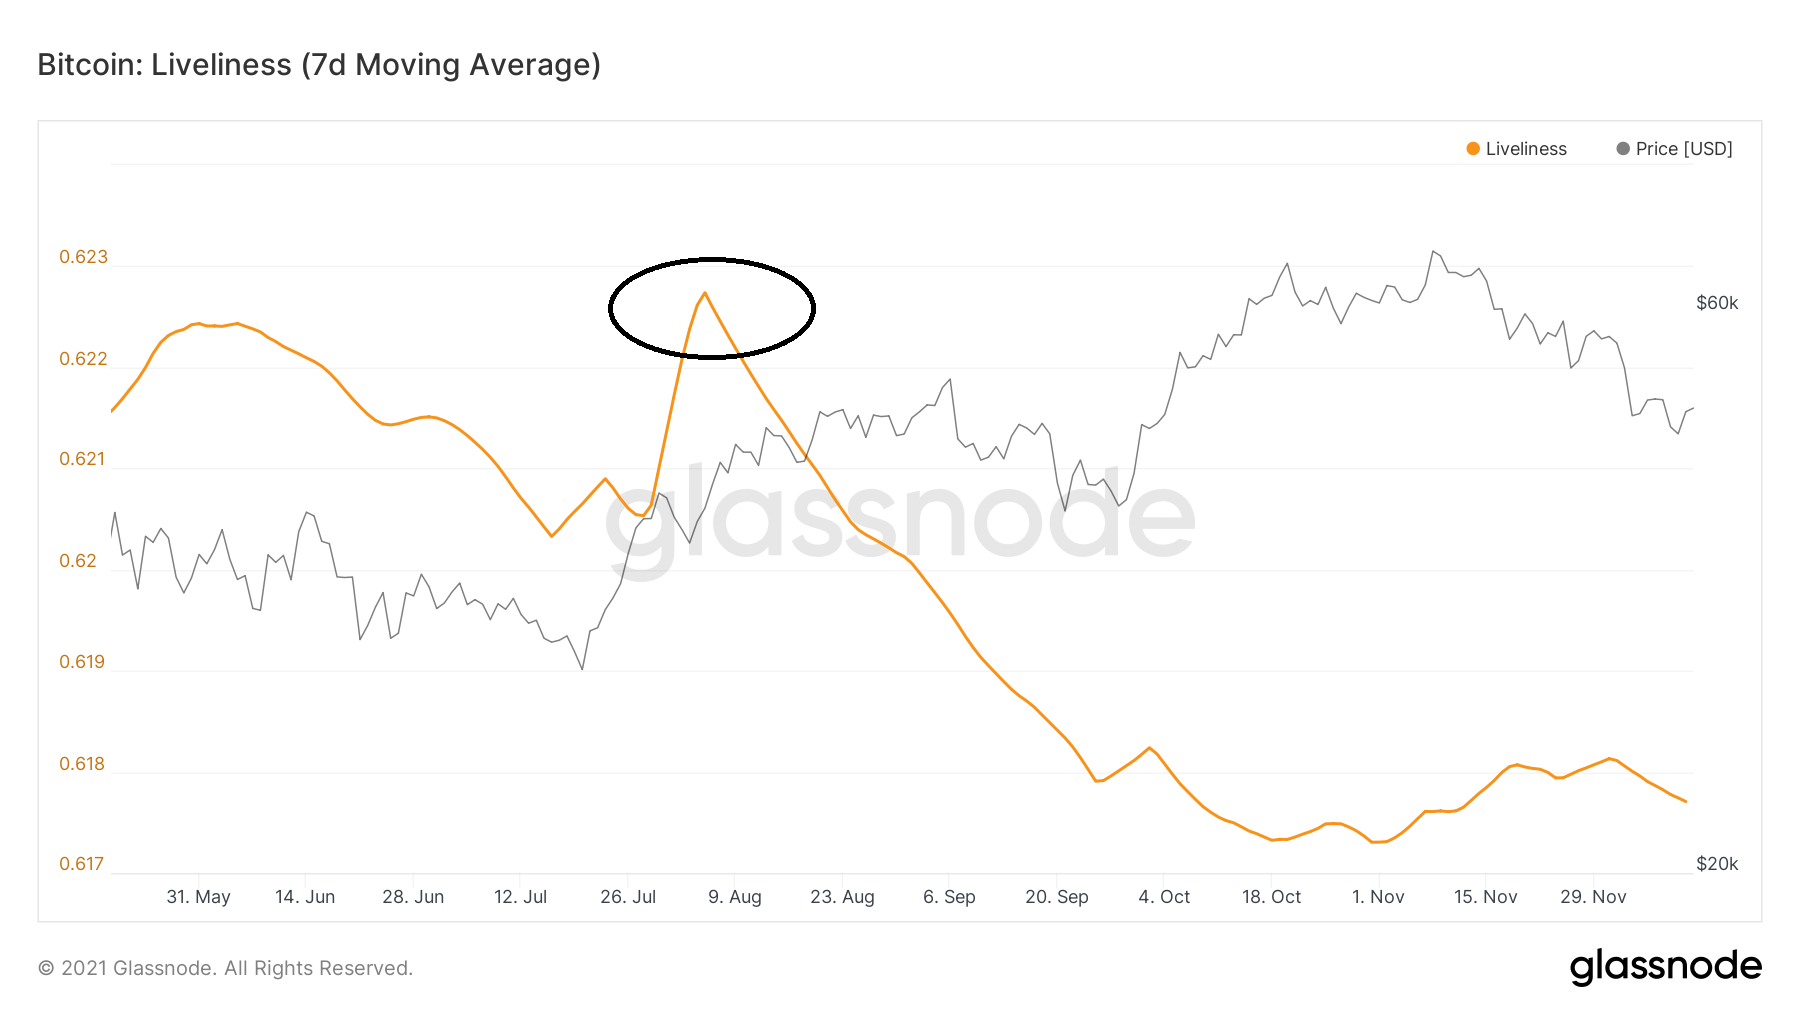
After BTC bounced in July, the indicator also spiked (black circle). However, since the end of Aug, when the BTC price was close to $50,000, liveliness has been falling.
This means that during the most recent part of the rally, old tokens are not being spent.
ASOL
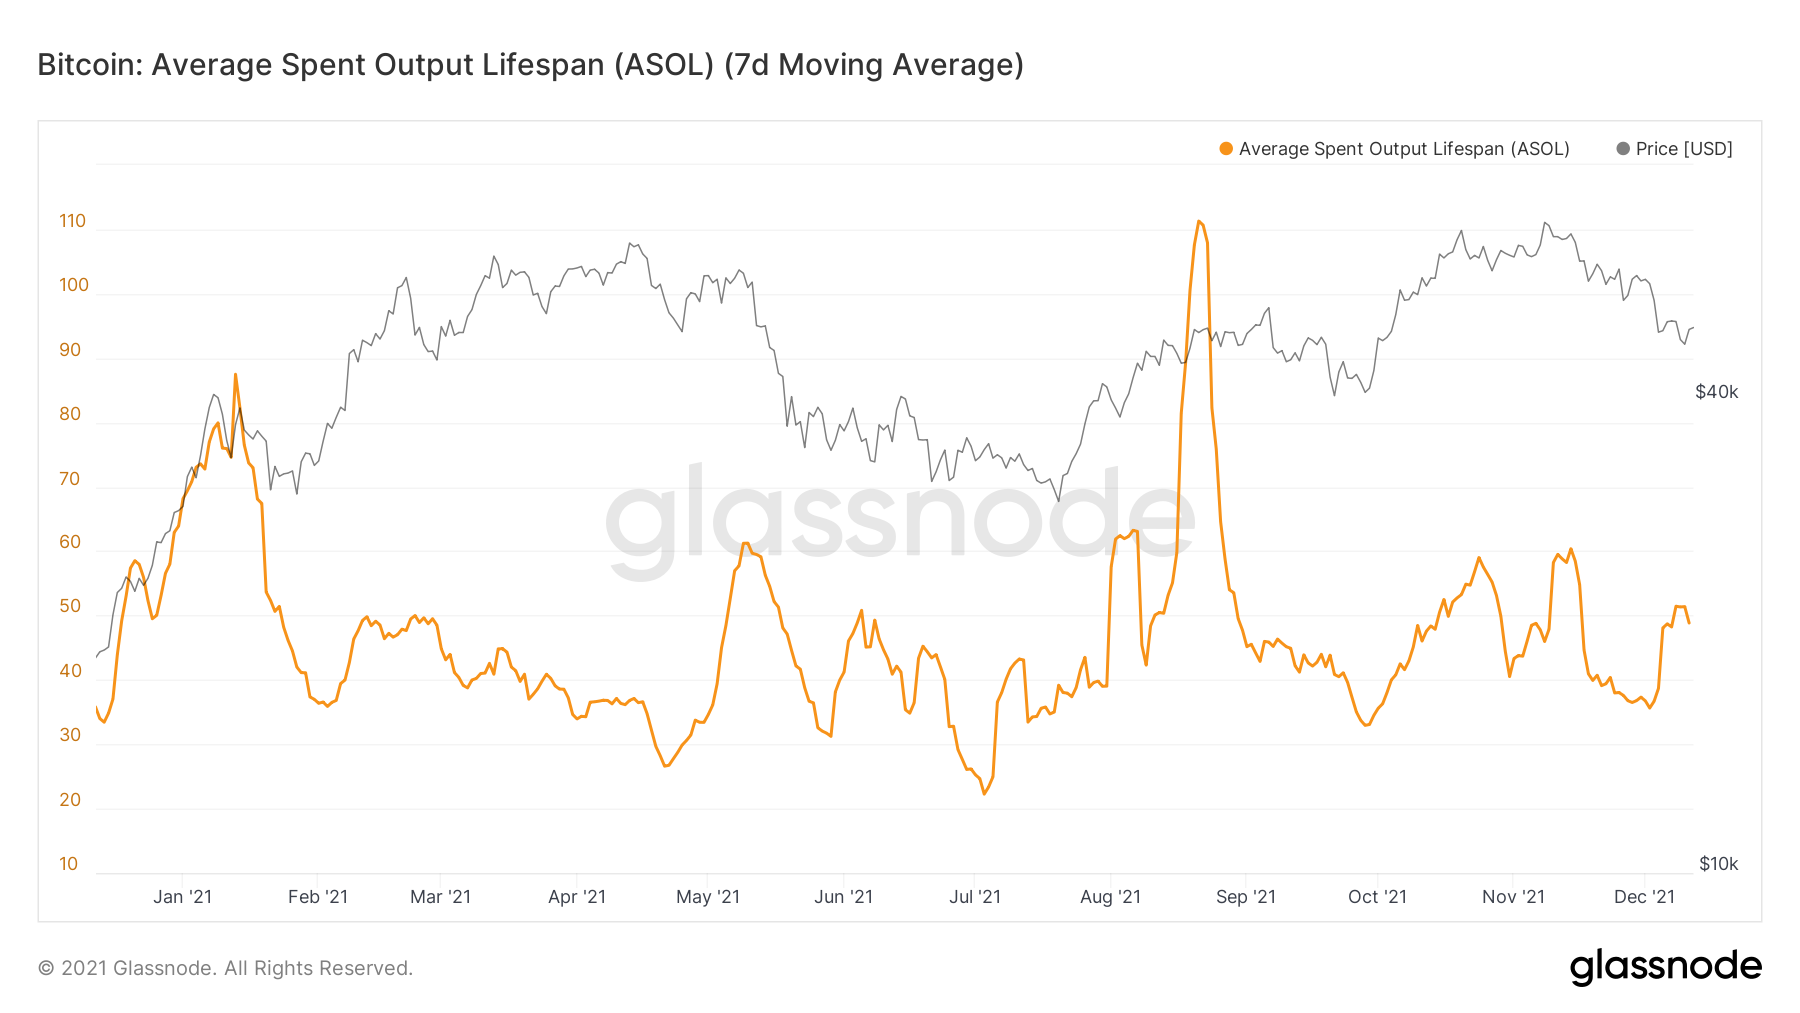
ASOL is also a lifespan indicator. It measures the average age (in days) of each transaction output. Therefore, a reading of 50 means that the previous time those tokens transacted was on average 50 days ago.
This year, ASOL has reached highs of 87.48 on Jan 13 and 111.29 on Aug 21 (black circles). The first transpired prior to the previous all-time high in April, while the second transpired after the considerable bounce in July.
Therefore, both these periods marked profit taking from older coins.
However, since then, ASOL has been decreasing and is currently close to 50. This means that profit taking by old coins has subsided, aligning with the liveliness reading.
CDD
CDD is also a lifespan indicator. For each day a coin remains unspent, it generates a ”coin day”. Once it is spent, those coin days are destroyed. Therefore, a higher reading means that coins have accumulated a lot of coin days, hence being long-term coins.
The movement of CDD is very similar to that of ASOL.
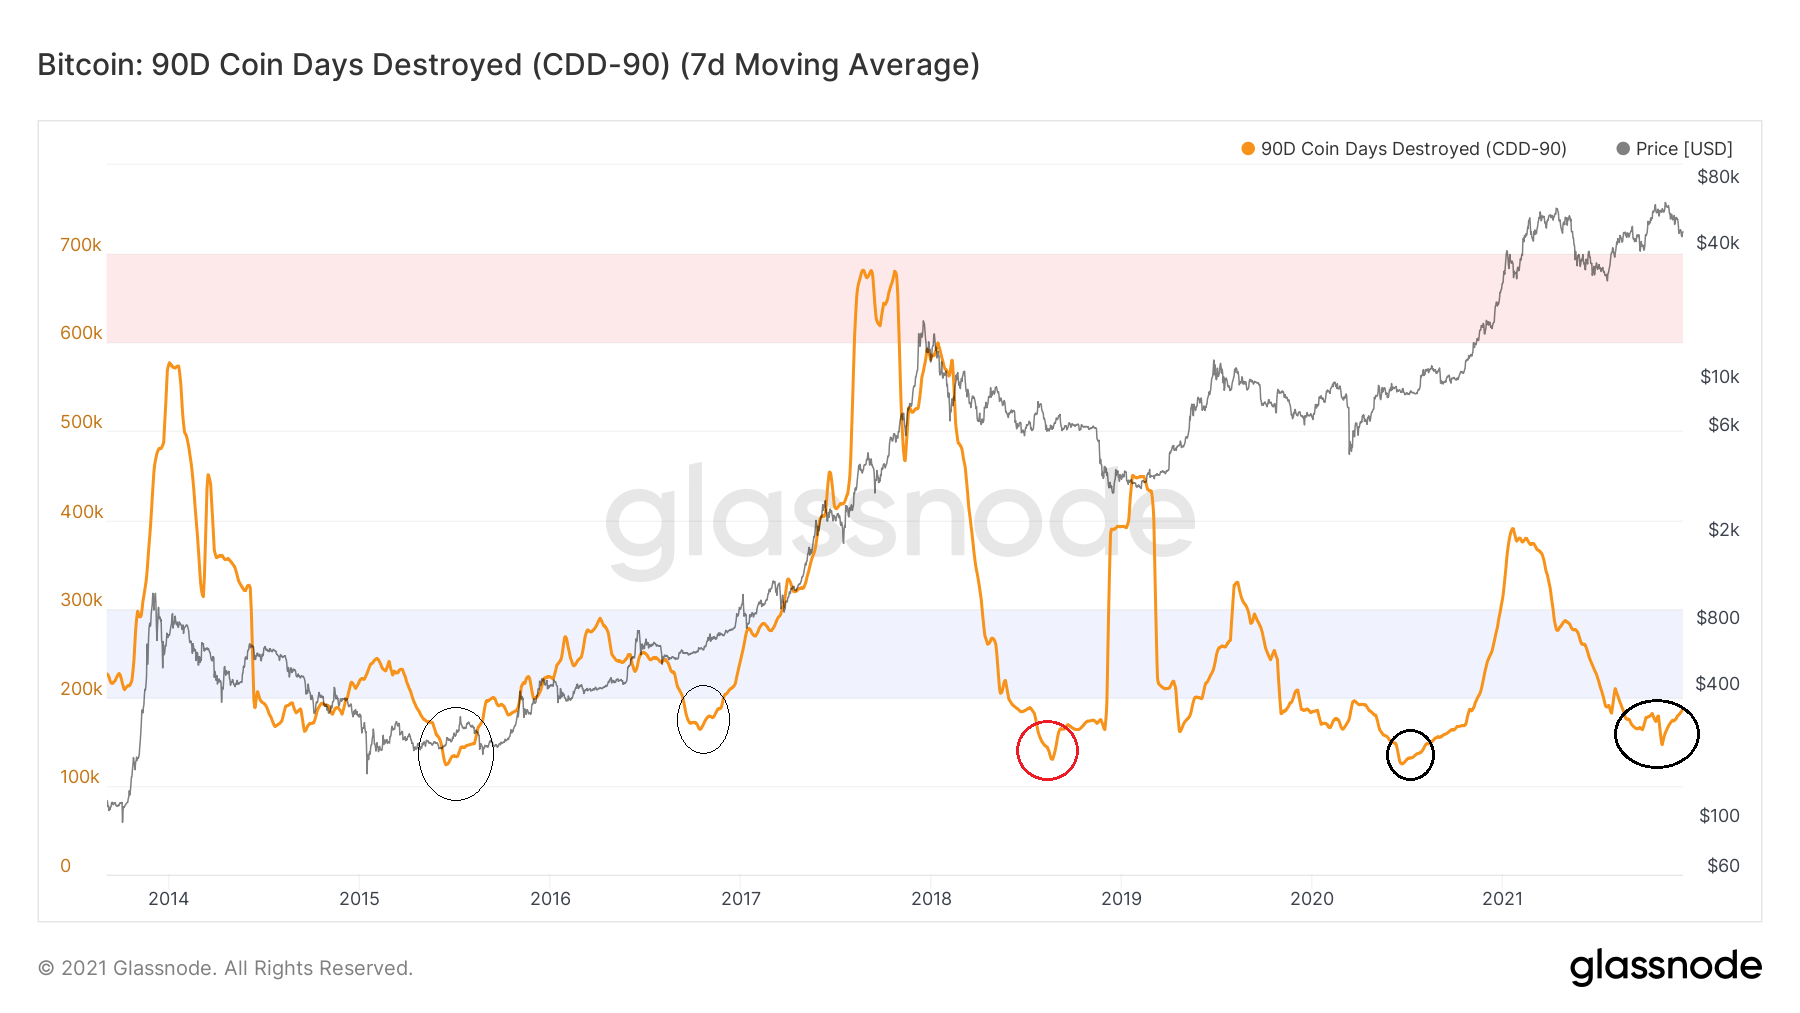
However, an interesting observation comes when looking at the 90-day rolling sum of CDD.
Readings between 200,000 and 300,000 (highlighted in blue) are considered low values. Sharp deviations below them have often been made close to the bottom (black circle). The only case in which a reversal did not transpire was on Oct 2018, when the BTC price eventually fell even though the CDD metric suggested a low has been made.
More recently, the 90-day CDD reached a low of 151,000, on Nov 4. Therefore, if previous history is followed, it might mean that a low has been made.
For BeInCrypto’s latest Bitcoin (BTC) analysis, click here
Disclaimer
All the information contained on our website is published in good faith and for general information purposes only. Any action the reader takes upon the information found on our website is strictly at their own risk.