Terra price prediction is significantly bullish as it trades in the green for a third consecutive daily session. Terra (LUNA) current rally has been boosted by the news that the asset was being listed on Kraken. After the news, LUNA price bounced off the 50-day Simple Movign Average (SMA) at $51.77 rallying 20% to the current price around $62.62.
Read along to find more about LUNA/USD being listed on Kraken and what it means for Terra Price Prediction.
Terra (LUNA) Digital Asset Live Trading Goes Live On Kraken
Kraken digital exchange has thrown its weight behind the Terra mainnet by listing its native token, LUNA, for trading on its exchange. The US based digital asset exchange made the announcement on their blog on December 14 urging investors to make their deposits in readiness for live trading on Thursday December 16. The announcement read:
“Funding is live, and trading will begin Thursday, December 16 — at which point Kraken will enable order entry and execution. … You can add LUNA to your Kraken account by navigating to Funding, selecting the asset, and hitting Deposit. Deposits require no confirmations. LUNA will be tradable against USD and EUR, with a price precision of 2 decimal places.”
The services that will be available for LUNA one it is listed on Kraken are Kraken and Kraken Terminal will be available for LUNA. Futures and margin trading will not be available at the moment.
These news coupled with the Federal Open Market Committee (FOMC) leaving interest rates unchanged and the Fed bond tapering plans are expected to bolster the recovery of global market adding fuel to the already impressive rally for LUNA.
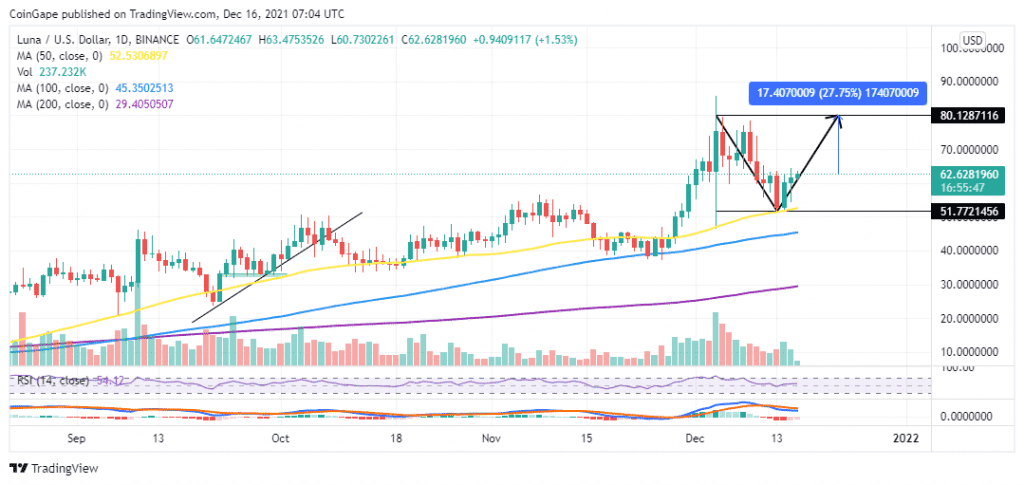
Terra Price Prediction: Luna’s V-Shaped Recovery Aims For $80
LUNA price formed a V-shaped chart pattern on the daily, indicating a sharp recovery. A V-shaped pattern is created when an asset falls significantly and then makes a sustained upswing. For example, Terra price currently hovers around $62.62 as bulls target highs beyond $80 representing approximately 27.75% rise.
The bullish narrative has been reinforced upward movement of the Moving Average Convergence Divergence (MACD) indicator above the zero line in the positive region. LUNA price bullish run will gain more traction once the MACD line (blue) crosses above the signal line (orange) which may occur in the near term.
Also note that the upsloping moving averages and the upward movement of the RSI towards the overbought region is an indication that bulls are currently in control of Terra.
LUNA/USD Daily Chart

On the flipside, the bullish Terra price prediction will be invalidated in LUNA records a daily closure below the $60 psychological level may trigger another downswing. If this happens, Terra price could re-test the support at $55 or drop further towards the December 13 low around $51.77.